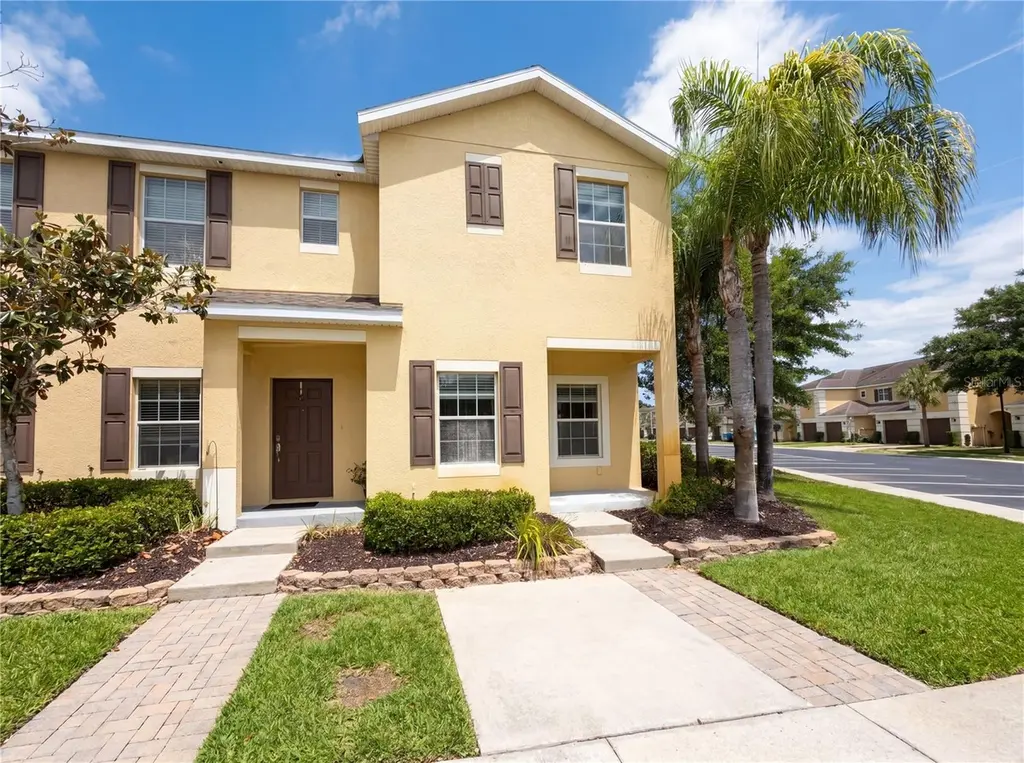
8548 Gablebend Way · Tampa, FL
Flood risk 1/10 · Minimal
- FEMA flood zone
- X (unshaded)
- Chance of flooding over 30 yrs
- 0.0%
- Est. flood insurance / yr
- $507 – $1,088
Fire risk 4/10 · Minor
- Est. fire insurance / yr
- $947 – $1,759
Heat risk 10/10 · Severe
- Hot days now (above 109°F)
- 7 days/yr
- Hot days in 30 yrs
- 27 days/yr
Wind risk 9/10 · Severe
- Chance of severe wind over 30 yrs
- 99.0%
Air-quality risk 2/10 · Minimal
- Unhealthy air days now
- 2 days/yr
- Unhealthy air days in 30 yrs
- 2 days/yr
Risk factors via First Street. Map © Google.
Why this score? — see what drove the D grade
The composite is a weighted blend of 9 inputs, each scored 0–100. Each bar is that input's sub-score; the figure is the points it added to the 100-point composite (weight × sub-score).
- ARV discount +15.0/15.0
- Cash flow +7.5/30.0
- 1% rule +4.5/10.0
- Schools +4.2/10.0
- Livability +4.0/5.0
- Condition / age +2.5/5.0
- Rent growth +2.2/5.0
- DSCR +1.6/10.0
- Appreciation +0.0/10.0
$197,000
🖨 Deal sheet (PDF) 📄 Offer letter ✓ Due diligence
Listing remarks
Welcome to this beautiful end-unit townhome in the gated community of The Hammocks— where style, privacy, and convenience come together perfectly. This spacious 2-bedroom, 2.5-bath home features a bright, open-concept main level designed for both relaxing and entertaining. The flowing layout offers a seamless connection between the living and dining areas, along with a convenient half bath for guests. Upstairs, you’ll find two generously sized bedrooms, each offering comfort and privacy. The primary suite is a true retreat, complete with a walk-in closet and ample space to unwind. As an end unit, this home enjoys added privacy and natural light, making it feel even more ope
Key facts
- $266 HOA
- Built 2012
- Listed 26 days
Property features AI
Finance
- Other: Total living area about 1192 square feet
- Financial info: Lease restrictions apply
- HOA & community: The Hammocks Townhomes HOA; HOA fees required (approximately $266.67/month; $800 quarterly total); Association approval required; Pets allowed
Exterior
- Parking: Assigned parking
- Utilities: Public water; Public sewer; Public utilities
- Home design: Attached townhouse; Two levels; Faces southeast
- Construction: Stucco construction; Shingle roof; Slab foundation
- Exterior features: Sidewalk; Paved road access
Interior
- Kitchen: Dishwasher; Microwave; Range; Refrigerator
- Bedrooms: 2 bedrooms
- Flooring: Carpet; Tile
- Bathrooms: 2 full bathrooms; 1 half bathroom
- Heating & cooling: Central heating; Central air
- Interior features: Ceiling fans
- Laundry & utility: Washer hookup; Electric dryer hookup
Neighborhood map
What this means for you Summary
Snapshot
- This is a 2-bed/3.0-bath townhouse listed at $197k.
Deal economics
- At list price, monthly cash flow is $-247 ($-3k/yr) — negative.
- To cash-flow at today's rent, offer at most $153k (22.1% below list).
- To meet the 1% rule (rent ≥ 1% of price), the offer needs to be $186k (5.4% below list).
- Recommended offer: $153k (22.1% below list) — sets the bar for cash-flow.
Location & tenants
- Location reads 79/100 on livability (#142 in FL, #2,135 nationally) — a middle-class / working-renter tenant base. Strengths: commute A+, housing A+, health & safety A+; Watch: crime D+.
- Hillsborough (suburban): math 47% / reading 50% proficiency, ranked #41 of 73 in FL (top 56%) — families likely to look elsewhere, expect single-tenant / working-renter base with shorter leases.
- Zoned schools: Turner-Bartels K-8 School (math 45% / reading 54%, grade D, #1,088 of 2,144 statewide, top 53%, 1,442 students, 43% FRL); Wharton High School (math 33% / reading 42%, grade F, #336 of 667 statewide, top 51%, 2,289 students, 46% FRL).
- Market conditions: Rents soft (-1.2%/yr); 493 active listings in the ZIP; 11 comparable units currently listed for rent nearby; rentals at typical pace (median 24d on market — plan ~3-4 weeks tenant-placement turnaround); solid renter incomes; 9,053 units permitted in Hillsborough County in 2024 (4,555 in 5+ unit buildings).
Forward outlook
- Local home prices are declining (-3.0%/yr); year-one equity from $1k of loan paydown is wiped out by about $6k of value loss. Plan a longer hold.
- Hillsborough County population projected at +37% by 2050 — long-run rental-demand tailwind backs the buy-and-hold thesis.
Negotiation context
- It's been on market 26 days — a 2% lower offer ($194k) is reasonable based on typical stale-listing flexibility.
- 5 sale attempts with the ask held roughly flat each time — persistent listings suggest the price (not the market) is what's stuck; bring a comps-based counter.
Risks & watch-outs
- Climate carrying-cost: severe wind risk, 99% chance of damaging wind over 30y; extreme-heat days projected 7→27/yr by 2055 (HVAC capex compounding) — expect insurance premiums to compound above CPI over the hold.
Questions for the listing agent
- What do current leases actually rent for vs. the listed asking? Can we see a recent rent roll and the last 12 months of T-12 income?
- What does the HOA fee cover, when was the last increase, and are there any pending special assessments or reserve-fund shortfalls?
- Is there a deadline driving the sale (1031 exchange, divorce, estate, relocation)? That informs how much negotiation room exists.
- Crime grade is D in this area — have there been break-ins, vandalism, or insurance claims at this property in the last 3 years? What carrier currently insures it and at what premium?
- The area grade is low — what's the realistic commute time and amenity access for the typical tenant pool here? Any planned neighborhood developments (good or bad) we should know about?
- What's the average days-on-market for RENTAL listings here right now (not sales)? A rising rental-DOM trend means longer vacancies and softer asking-rent achievability than the comps imply.
- What's the recent tenant-quality profile in this submarket — average credit score on applications, eviction rate, late-payment / NSF rate, and stable-employment percentage? A property-management company in the area should have these aggregated.
- How much new for-sale + rental construction is in the pipeline within 1–3 miles? Heavy new supply typically softens prices + rents 12–24 months out; constrained supply supports both.
Investment metrics
- 1% rule
- 0.95% ✗
- Cap rate
- 4.79%
- Cash-on-cash
- -5.37%
- DSCR
- 0.76
- GRM
- 8.8
CMA / ARV
- ARV (median comp)
- $298,104
- List price
- $197,000
- Delta
- -33.92%
- Verdict
- UNDERPRICED
- Comps
- 8 within 2.0 mi
Projected returns pro-forma
-3.0% appreciation · 0.0% rent growth · sell at horizon
- IRR
- -29.8%
- Equity multiple
- 0.04×
- Total profit
- $-52,858
- Equity at exit
- $29,373
- IRR
- -58.2%
- Equity multiple
- -0.57×
- Total profit
- $-86,366
- Equity at exit
- $17,033
Cash invested: $55,160 (down + closing). Projections, not guarantees.
Landlord ↔ Tenant lean methodology
- Overall (STATE)
- 87 Strongly Landlord-Friendly
- State Florida
- 87 Strongly Landlord-Friendly · R+3
- County
- — inherits STATE
- City
- — inherits STATE
ZIP-level market 33647
- Home prices YoY
- -23.7%
- Rents YoY
- -1.2%
- Active inventory
- 493
- Price-to-rent
- 8.8×
Monthly cashflow live
- Estimated rent
- $1,863 high interval (Pro) →
- Mortgage (P&I)
- −$1,033
- Tax from tax record
- −$337 /mo · $4,047/yr
- Insurance
- −$82
- HOA
- −$266
- Vacancy / Maint / Mgmt
- −$391
- Net cashflow
- $-247
Break-even live
Sensitivity live
| Price | -10% $-135 | -5% $-191 | +0% $-247 | +5% $-303 | +10% $-358 |
|---|---|---|---|---|---|
| Rent | -10% $-394 | -5% $-320 | +0% $-247 | +5% $-173 | +10% $-100 |
| Rate | -1.0pp $-148 | -0.5pp $-197 | base $-247 | +0.5pp $-298 | +1.0pp $-350 |
UW: 25.0% down · 7.5% · 30yr · 1.5% tax · 5.0% vac · 8.0% maint · 8.0% mgmt
Financing live
Cash to close
- Down payment
- $49,250
- Closing costs
- $5,910
- Reserves months
- —
- Total cash needed
- —
Loan-product check · same deal, 3 products live
Conventional
25% down · 7.5% · 30yr
- Down + closing
- —
- Monthly P&I
- —
- Monthly cashflow
- —
- DSCR
- —
- Eligible?
- —
Personal DTI + credit; lowest rate.
DSCR
20% down · 8.5% · 30yr
- Down + closing
- —
- Monthly P&I
- —
- Monthly cashflow
- —
- DSCR
- —
- Eligible?
- —
No personal income docs; deal must DSCR.
Hard money
10% down · 12.0% · 12mo
- Down + closing
- —
- Monthly P&I
- —
- Monthly cashflow
- —
- DSCR
- —
- Eligible?
- —
Short-term bridge; refi at stabilization.
Rent comps 11 comps
| Address | Beds | Baths | Sqft | Rent | $/sqft | DOM | Units | Dist |
|---|---|---|---|---|---|---|---|---|
| 8533 Gablebend Way Tampa, FL | 2.0 | 2.5 | 1292 | $1,750 | $1.35 | 26d | 1 | 0.01mi |
| 8503 Brushleaf Way Tampa, FL | 2.0 | 2.5 | 1088 | $1,873 | $1.72 | 7d | 1 | 0.07mi |
| 8545 Trail Wind Dr Tampa, FL | 2.0 | 2.5 | 1144 | $1,750 | $1.53 | 26d | 1 | 0.08mi |
| 8519 Trail Wind Dr Tampa, FL | 2.0 | 2.5 | 1008 | $1,700 | $1.69 | 16d | 1 | 0.08mi |
| 8553 Trail Wind Dr Tampa, FL | 2.0 | 3.0 | 1192 | $1,650 | $1.38 | 26d | 1 | 0.08mi |
| 20410 Needletree Dr Tampa, FL | 2.0 | 2.5 | 1410 | $2,000 | $1.42 | 26d | 1 | 0.08mi |
| 20460 Needletree Dr Tampa, FL | 3.0 | 2.5 | 1410 | $2,299 | $1.63 | 26d | 1 | 0.09mi |
| 6398 Colonial Grand Dr Tampa, FL | 1.0–3.0 | 1.0–2.0 | 1075 | $2,033 | $1.89 | 0d | 47 | 0.64mi |
| 20404 Harvest Oak Ct Tampa, FL | 3.0 | 2.5 | 1455 | $2,200 | $1.51 | 4d | 1 | 0.99mi |
| 20314 Noble Oak Pl Unit 1 Tampa, FL | 3.0 | 2.5 | 1455 | $2,299 | $1.58 | 23d | 1 | 1.12mi |
| 18940 Pebble Links Cir Tampa, FL | 1.0–2.0 | 1.0–2.0 | 1048 | $1,851 | $1.77 | 1d | 15 | 1.30mi |
HOA detail
- Monthly dues
- $266 · $3,192/yr
- Likely covers
- security
Listing history 11 events
-
2026-06-02status $197,000 Pending 26 DOM
-
2026-06-01days on market $197,000 Active 26 DOM
-
2026-05-31days on market $197,000 Active 25 DOM
-
2026-05-03$197,000 Active 1109-char remark
-
2025-09-02$222,900 Active
-
2025-01-29historical $1,650
-
2025-01-29historical $1,650
-
2025-01-10$1,650
-
2025-01-09$1,650
-
2010-06-30soldstatus $750,000
-
2006-06-12soldstatus $1,510,500
ⓘ Source: listings_history table (triggers on properties + properties_extension) + one-shot
backfill from property_details.listing_events for pre-trigger history.
Tax reassessment forecast FL · Resets to sale price
- Current annual tax
- $4,047 · $337/mo
- Projected year-2 tax
- $4,047 · $337/mo
- Expected delta
- $0/yr ($0/mo · 0.0%)
ⓘ Screening estimate from a state-policy table — verify with the county assessor before closing.
Climate risk First Street
- Flood 1/10 Low FEMA zone X (unshaded) · 0% chance over 30 yrs
- Wildfire 4/10 Moderate
- Heat 10/10 Extreme 7 d/yr ≥109°F today · 27 d/yr by 30 yrs out
- Wind 9/10 Extreme 99% chance of damaging wind over 30 yrs
- Air quality 2/10 Low 2 unhealthy d/yr today · 2 by 30 yrs out
Nearby sold comps map
Loading sold comps map…
Walkable amenities ~0.75 mi
Loading nearby amenities…
Taxation est. · year 1
- Rental income
- $22,352
- − Mortgage interest
- −$11,035
- − Property taxes
- −$4,047
- − Insurance
- −$985
- − Repairs & maintenance
- −$1,788
- − Management
- −$1,788
- − HOA
- −$3,192
- − Depreciation
- −$5,731
- Taxable loss
- −$6,214
- Est. tax savings @ 24.0%
- +$1,491
- After-tax cash flow
- $-1,471/yr
For passive investors: Depreciation is non-cash, so a rental often shows a tax loss while cash-flowing — sheltering income. Rental losses are passive: they offset passive income freely, and up to $25,000/yr can offset ordinary (W-2) income if you actively participate and your MAGI is under $100k (phasing out to $0 by $150k); unused losses carry forward. On sale, claimed depreciation is recaptured at up to 25%, and gains may owe capital-gains tax (a 1031 exchange can defer both). Figures are a year-1 estimate at your 24.0% rate — not tax advice; consult a CPA.
Schools (NCES district)
- District
- Hillsborough
- NCES district ID
- 1200870
- Math proficiency
- 47% ▼ -8.00%
- Reading proficiency
- 50% ▼ -4.00%
- Median HH income
- $50,622
- Composite
- 41.6/100
- National rank
- #3435
- State rank
- #41 of 73 in FL
Livability — Tampa
- Score
- 79/100
- State rank
- #142
- US rank
- #2135
Category grades
Schools grade is shown separately in the Schools card above.
Census & demographics
- Census place
- Tampa, FL
- County
- Hillsborough County · 1,540,968 people
- City population
- 523,346
- Metro
- Tampa-St. Petersburg-Clearwater, FL
- Population (ZIP)
- 74,844
- Household income
- $109,285
- Rent vs Own
- Severe rent burden
- 2578.0
Population outlook (Hillsborough County) Hauer SSP2
- Today (2025)
- 1,607,022 people
- By 2030
- 1,733,968 · +7.9%
- By 2040
- 1,979,565 · +23.2%
- By 2050
- 2,203,427 · +37.1%
- By 2075
- 2,667,893 · +66.0%
- By 2100
- 2,891,558 · +79.9%
Race, ethnicity, and origin ACS 2023
- Neighborhood character
- Highly diverse neighborhood (Simpson 0.73)
- Race & ethnicity
- White 43% Hispanic / Latino 20% Asian 16% Black 16% Two or more races 15%
- Hispanic origin (detail)
- Mexican 1% Puerto Rican 5% Cuban 2% Dominican 2%
- Common ancestry
- Romanian 2% Lithuanian 1% Hispanic 1%
- Foreign-born
- 27% · Canada, China, Jamaica
- Languages at home
- 62% English-only · Spanish 16% Other Indo-European 7% Arabic 4%
Political lean MEDSL · Hillsborough
- 2024 margin
- Toss-up / Even · D 47.8% · R 50.9% · Other 1.3%
- 2008→2024 swing
- -10.2pp toward R · 2008: 7.1pp · 2024: -3.1pp
- All cycles
- 2024: R+3.1 2020: D+6.9 2016: D+6.8 2012: D+6.7 2008: D+7.1
Not yet ingested
- Civics
- —
Market trends
- HPI YoY
- ▼ -69.77%
- Current HPI
- 225.0483
- Rent YoY
- ▼ -1.18%
- Metro
- Tampa-St. Petersburg-Clearwater, FL
- State GDP YoY
- ▲ 3.28%
- F500 in state
- 36
Industry mix (Fortune 500 HQ in FL)
| Industry | F500 HQs | Revenue |
|---|---|---|
| Industrial Technology | 2 | $29B |
|
||
| Insurance | 2 | $17B |
|
||
| Retail | 1 | $60B |
|
||
| Technology Distribution | 1 | $58B |
|
||
| Homebuilding | 1 | $35B |
|
||
| Technology Manufacturing | 1 | $35B |
|
||
Price history
-87.0% since first listed11 events — show timeline
- 2026-06-01 Pending — Stellar MLS as Distributed by MLS Grid
- 2026-05-22 Relisted — Stellar MLS as Distributed by MLS Grid
- 2026-05-19 Pending — Stellar MLS as Distributed by MLS Grid
- 2026-05-03 Listed $197,000 Stellar MLS as Distributed by MLS Grid
- 2025-09-02 Listed $222,900 Stellar MLS as Distributed by MLS Grid
- 2025-01-29 Rental Removed $1,650 RENT.
- 2025-01-29 Rental Removed $1,650 STELLARMLS
- 2025-01-10 Listed for Rent $1,650 RENT.
- 2025-01-09 Listed for Rent $1,650 STELLARMLS
- 2010-06-30 Sold (Public Records) $750,000 Public Records
- 2006-06-12 Sold (Public Records) $1,510,500 Public Records
Property tax history
+3.4%/yrLatest (2025): $4,047 · -0.1% YoY. Source: county tax records.
Cash-flow waterfall
monthlySold comps — $/sqft
last 12 mo · ≤1 miLoading sold comps…