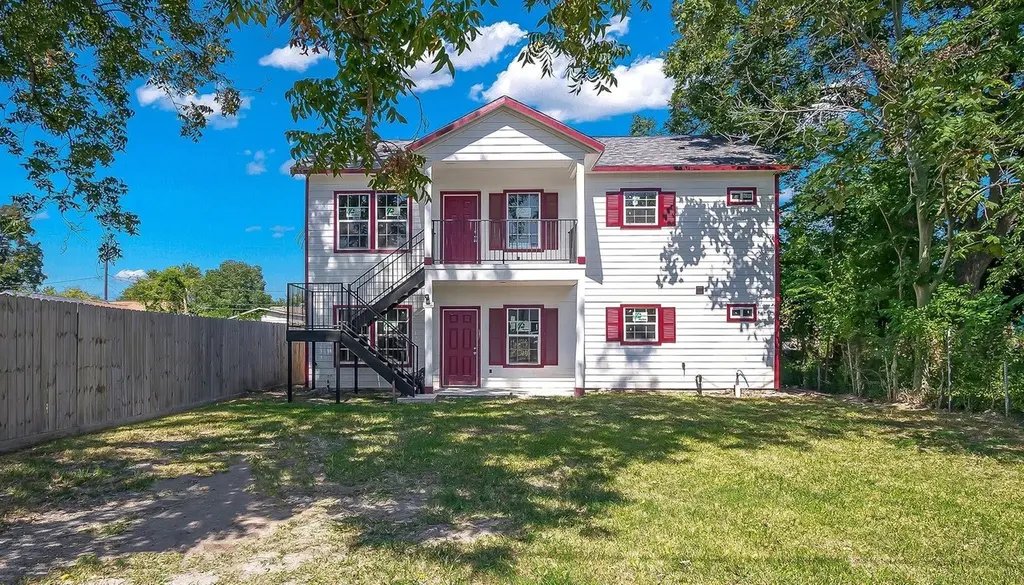
3117 E Crosstimbers St
Houston, TX 77093
$265,000D+
4 bd · 4.0 ba ·
2,184 sqft ·
Built 2020
· MultiFamily
· Pending
· 141 DOM
Cashflow @ list (25.0% down · 7.5%)
Estimated rent
$2,468/mo
Mortgage (P&I)
−$1,390
Tax + insurance
−$564
HOA
−$0
Vac / Maint / Mgmt
−$518
Net cashflow
$-4/mo
Annual
$-50/yr
Cap rate
6.27%
Cash-on-cash
-0.07%
DSCR
1.00
1% rule
0.93%
Cash to close
$74,200
Investor read
- This is a 2 × 2-bed/2.0-bath units multifamily listed at $265k.
- At list price, monthly cash flow is $-4 ($-50/yr) — negative. Per door: $-2/mo.
- To cash-flow at today's rent, offer at most $264k (0.3% below list).
- To meet the 1% rule (rent ≥ 1% of price), the offer needs to be $247k (6.9% below list).
- It's been on market 141 days — a 12% lower offer ($233k) is reasonable based on typical stale-listing flexibility.
- Recommended offer: $233k (12.0% below list) — sets the bar for market timing.
- Local home prices are declining (-3.0%/yr); year-one equity from $2k of loan paydown is wiped out by about $8k of value loss. Plan a longer hold.
- Location reads 74/100 on livability (#184 in TX, #4,771 nationally) — a middle-class / working-renter tenant base. Strengths: amenities A+, cost of living A+, housing A+; Watch: schools D, crime F.
- Houston ISD (urban): math 27% / reading 35% proficiency, ranked #593 of 826 in TX (top 72%) — families likely to look elsewhere, expect single-tenant / working-renter base with shorter leases; 71% free/reduced lunch — lower-income household profile, screen leases tightly.
- Market conditions: Rents rising fast (+5.3%/yr); 148 active listings in the ZIP; 10 comparable units currently listed for rent nearby; rentals at typical pace (median 24d on market — plan ~3-4 weeks tenant-placement turnaround); 40% of comp listings sitting > 30 days — soft ceiling on asking rent; 29,883 units permitted in Harris County in 2024 (8,621 in 5+ unit buildings).
- Harris County population projected at +47% by 2050 — long-run rental-demand tailwind backs the buy-and-hold thesis.
- 4 sale attempts since 4y ago with the ask held roughly flat each time — persistent listings suggest the price (not the market) is what's stuck; bring a comps-based counter.
- Climate carrying-cost: major flood risk; severe wind risk, 99% chance of damaging wind over 30y; extreme-heat days projected 7→24/yr by 2055 (HVAC capex compounding) — expect insurance premiums to compound above CPI over the hold.
- Cap rate 6.3% vs local median 3.2% in Houston — top-decile yield for the area; either an underpriced asset or a hidden risk that comps aren't pricing in. Stress-test before assuming the spread holds.
- At $2,468/mo this rent would consume 63% of the median local household income ($47k/yr) (locally 1815% of renters already pay >50% of income on rent) — very limited rent-growth headroom before tenants either downsize or default.
Questions for listing agent
- What do current leases actually rent for vs. the listed asking? Can we see a recent rent roll and the last 12 months of T-12 income?
- It's been on market 141 days. Have you received any prior offers? Is the seller open to a 12% concession, seller financing, or rate buy-down credit?
- Can we see the unit-by-unit rent roll, current vacancy, and any below-market leases? What's the average tenancy length?
- What capital expenditures (roof, boiler, parking lot, exteriors) have been made in the last 5 years, and what's planned in the next 2?
- Why hasn't it sold? Are there any deal-killer items the seller is aware of (foundation, flood, title, zoning, code violations)?
- Is there a deadline driving the sale (1031 exchange, divorce, estate, relocation)? That informs how much negotiation room exists.
- Schools are D-rated, which usually means shorter tenancies and higher turnover. Who's the typical renter profile here, and what's been the actual vacancy rate?
- Crime grade is F in this area — have there been break-ins, vandalism, or insurance claims at this property in the last 3 years? What carrier currently insures it and at what premium?
CashFlowRE · CFR-CWC1Z790VCVXYY
· Data 1 week ago
cashflowre.app · 2026-05-29