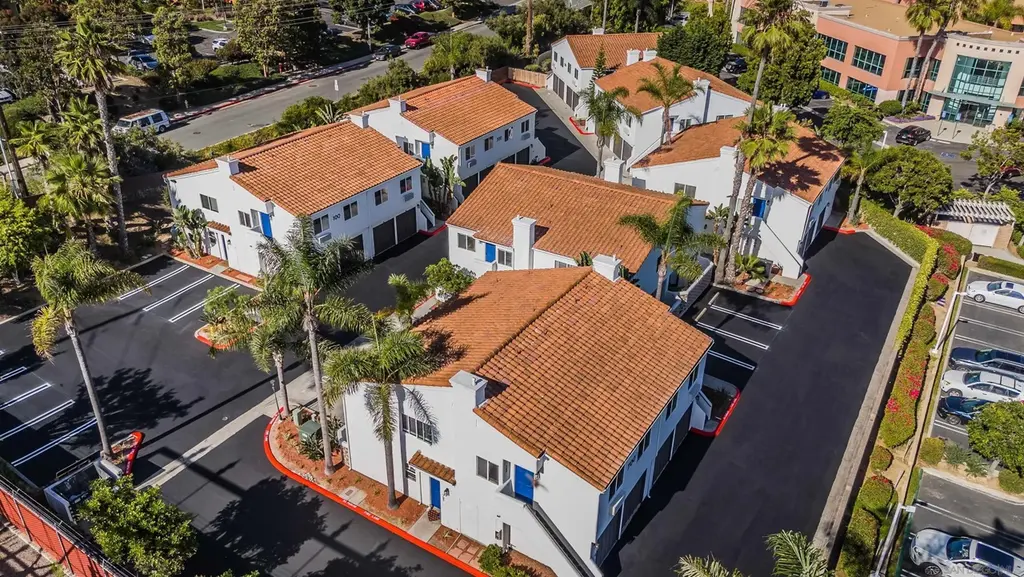
185 Saxony Rd
Encinitas, CA 92024
$20,100,000D
1440 bd · 1440.0 ba ·
7,550 sqft ·
Built 1988
· MultiFamily
· Active
· 48 DOM
Cashflow @ list (25.0% down · 7.5%)
Estimated rent
$153,469/mo
Mortgage (P&I)
−$105,407
Tax + insurance
−$20,624
HOA
−$0
Vac / Maint / Mgmt
−$32,228
Net cashflow
$-4,790/mo
Annual
$-57,477/yr
Cap rate
6.01%
Cash-on-cash
-1.02%
DSCR
0.95
1% rule
0.76%
Cash to close
$5,628,000
Investor read
- This is a 32 × 45-bed/45.0-bath units multifamily listed at $20.10M.
- At list price, monthly cash flow is $-5k ($-57k/yr) — negative. Per door: $-150/mo.
- To cash-flow at today's rent, offer at most $19.25M (4.2% below list).
- To meet the 1% rule (rent ≥ 1% of price), the offer needs to be $15.35M (23.6% below list).
- It's been on market 48 days — a 3% lower offer ($19.50M) is reasonable based on typical stale-listing flexibility.
- Recommended offer: $15.35M (23.6% below list) — sets the bar for 1% rule.
- Local home prices are declining (-3.0%/yr); year-one equity from $139k of loan paydown is wiped out by about $603k of value loss. Plan a longer hold.
- Location reads 79/100 on livability (#54 in CA, #2,026 nationally) — a middle-class / working-renter tenant base. Strengths: amenities A+, commute A+, employment A+; Watch: health & safety C-, cost of living F.
- San Dieguito Union High (urban): math 72% / reading 79% proficiency, ranked #56 of 1,400 in CA (top 4%) — strong family-tenant draw, lease renewals of 3-5y typical; only 8% free/reduced lunch — higher-income household profile.
- Zoned schools: Capri Elementary (631 students, 25% FRL); Oak Crest Middle (802 students, 24% FRL); Canyon Crest Academy (2,336 students, 11% FRL).
- Market conditions: Rents rising fast (+5.4%/yr); 208 active listings in the ZIP; high-income renter base; 11,759 units permitted in San Diego County in 2024 (7,244 in 5+ unit buildings).
- San Diego County population projected at +20% by 2050 — long-run rental-demand tailwind backs the buy-and-hold thesis.
- 10 sale attempts since 3y ago with the ask held roughly flat each time — persistent listings suggest the price (not the market) is what's stuck; bring a comps-based counter.
- Current owner paid $3.45M; list at $20.10M implies a 483% gain — meaningful room to come down on a strong offer.
- Cap rate 6.0% vs local median 1.6% in Encinitas — top-decile yield for the area; either an underpriced asset or a hidden risk that comps aren't pricing in. Stress-test before assuming the spread holds.
- At $153,469/mo this rent would consume 1162% of the median local household income ($159k/yr) (locally 1537% of renters already pay >50% of income on rent) — very limited rent-growth headroom before tenants either downsize or default.
Questions for listing agent
- What do current leases actually rent for vs. the listed asking? Can we see a recent rent roll and the last 12 months of T-12 income?
- It's been on market 48 days. Have you received any prior offers? Is the seller open to a 24% concession, seller financing, or rate buy-down credit?
- Can we see the unit-by-unit rent roll, current vacancy, and any below-market leases? What's the average tenancy length?
- What capital expenditures (roof, boiler, parking lot, exteriors) have been made in the last 5 years, and what's planned in the next 2?
- Is there a deadline driving the sale (1031 exchange, divorce, estate, relocation)? That informs how much negotiation room exists.
- Schools are A-rated — typically a magnet for longer-tenancy family renters. What's the average tenant stay here, and is there a school-zone premium baked into asking?
- The area grade is low — what's the realistic commute time and amenity access for the typical tenant pool here? Any planned neighborhood developments (good or bad) we should know about?
- What's the average days-on-market for RENTAL listings here right now (not sales)? A rising rental-DOM trend means longer vacancies and softer asking-rent achievability than the comps imply.
CashFlowRE · CFR-CXG7AZ0KXCKV9B
· Data 23 h ago
cashflowre.app · 2026-05-29