 32-Plex
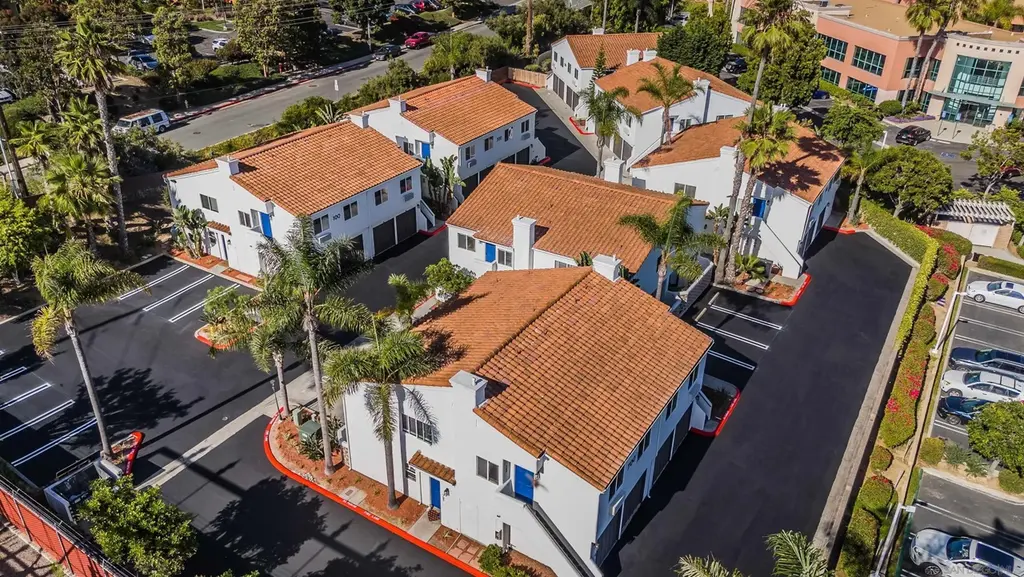
185 Saxony Rd · Encinitas, CA
Flood risk 1/10 · Minimal
- FEMA flood zone
- X (unshaded)
- Chance of flooding over 30 yrs
- 0.0%
- Est. flood insurance / yr
- $507 – $1,088
Fire risk 2/10 · Minimal
- Est. fire insurance / yr
- $659 – $1,223
Heat risk 4/10 · Minor
- Hot days now (above 84°F)
- 7 days/yr
- Hot days in 30 yrs
- 20 days/yr
Wind risk 1/10 · Minimal
- Chance of severe wind over 30 yrs
- —
Air-quality risk 3/10 · Minor
- Unhealthy air days now
- 4 days/yr
- Unhealthy air days in 30 yrs
- 4 days/yr
Risk factors via First Street. Map © Google.
Why this score? — see what drove the D grade
The composite is a weighted blend of 9 inputs, each scored 0–100. Each bar is that input's sub-score; the figure is the points it added to the 100-point composite (weight × sub-score).
- Cash flow +12.0/30.0
- ARV discount +7.5/15.0
- Schools +7.1/10.0
- Livability +4.0/5.0
- Rent growth +3.8/5.0
- DSCR +3.5/10.0
- 1% rule +2.6/10.0
- Condition / age +2.5/5.0
- Appreciation +0.0/10.0
$20,100,000
🖨 Deal sheet (PDF) 📄 Offer letter ✓ Due diligence
Multi-family units
County records classify this as Multi-Family (5+ Unit). Listing-text estimate: 32 units. confirmed
5+ unit building — per-unit beds/baths from public records are typically unavailable; the breakdown below (if shown) is an estimate from the listing text.
Listing remarks
Kidder Mathews is proud to exclusively offer for sale this fully renovated, 32-unit luxury apartment community in the heart of coastal Encinitas. Nestled in one of North San Diego County’s most coveted beachside enclaves—just 0.8 miles from Moonlight State Beach and under 1 mile from Downtown Encinitas’ bustling shops, restaurants, and surf culture— The Gemma delivers an irreplaceable walk-to-everything lifestyle in a market with virtually no new supply. This turn-key trophy asset has undergone a complete 2025 renovation to institutional standards, featuring all-new quartz countertops, fully renovated kitchens and bathrooms, luxury vinyl plank flooring, new AC units,
Key facts
- Fully renovated
- New ac units
- Brand-new roof
Tags
Property features AI
Finance
- Other: Building size reported as 18,690 total square feet
Exterior
- Utilities: Lot size reported in acres
- Home design: Residential income property (Commercial-Residential Income subtype)
Interior
- Bathrooms: 45 full bathrooms
- Interior features: 45 full bathrooms
Neighborhood map
What this means for you Summary
Snapshot
- This is a 32 × 45-bed/45.0-bath units multifamily listed at $20.10M.
Deal economics
- At list price, monthly cash flow is $-5k ($-57k/yr) — negative. Per door: $-150/mo.
- To cash-flow at today's rent, offer at most $19.25M (4.2% below list).
- To meet the 1% rule (rent ≥ 1% of price), the offer needs to be $15.35M (23.6% below list).
- Recommended offer: $15.35M (23.6% below list) — sets the bar for 1% rule.
- Cap rate 6.0% vs local median 1.6% in Encinitas — top-decile yield for the area; either an underpriced asset or a hidden risk that comps aren't pricing in. Stress-test before assuming the spread holds.
Location & tenants
- Location reads 79/100 on livability (#54 in CA, #2,026 nationally) — a middle-class / working-renter tenant base. Strengths: amenities A+, commute A+, employment A+; Watch: health & safety C-, cost of living F.
- San Dieguito Union High (urban): math 72% / reading 79% proficiency, ranked #56 of 1,400 in CA (top 4%) — strong family-tenant draw, lease renewals of 3-5y typical; only 8% free/reduced lunch — higher-income household profile.
- Zoned schools: Capri Elementary (631 students, 25% FRL); Oak Crest Middle (802 students, 24% FRL); Canyon Crest Academy (2,336 students, 11% FRL).
- Market conditions: Rents rising fast (+5.4%/yr); 208 active listings in the ZIP; high-income renter base; 11,759 units permitted in San Diego County in 2024 (7,244 in 5+ unit buildings).
- At $153,469/mo this rent would consume 1162% of the median local household income ($159k/yr) (locally 1537% of renters already pay >50% of income on rent) — very limited rent-growth headroom before tenants either downsize or default.
Forward outlook
- Local home prices are declining (-3.0%/yr); year-one equity from $139k of loan paydown is wiped out by about $603k of value loss. Plan a longer hold.
- San Diego County population projected at +20% by 2050 — long-run rental-demand tailwind backs the buy-and-hold thesis.
Negotiation context
- It's been on market 48 days — a 3% lower offer ($19.50M) is reasonable based on typical stale-listing flexibility.
- 10 sale attempts since 3y ago with the ask held roughly flat each time — persistent listings suggest the price (not the market) is what's stuck; bring a comps-based counter.
- Current owner paid $3.45M; list at $20.10M implies a 483% gain — meaningful room to come down on a strong offer.
Questions for the listing agent
- What do current leases actually rent for vs. the listed asking? Can we see a recent rent roll and the last 12 months of T-12 income?
- It's been on market 48 days. Have you received any prior offers? Is the seller open to a 24% concession, seller financing, or rate buy-down credit?
- Can we see the unit-by-unit rent roll, current vacancy, and any below-market leases? What's the average tenancy length?
- What capital expenditures (roof, boiler, parking lot, exteriors) have been made in the last 5 years, and what's planned in the next 2?
- Is there a deadline driving the sale (1031 exchange, divorce, estate, relocation)? That informs how much negotiation room exists.
- Schools are A-rated — typically a magnet for longer-tenancy family renters. What's the average tenant stay here, and is there a school-zone premium baked into asking?
- The area grade is low — what's the realistic commute time and amenity access for the typical tenant pool here? Any planned neighborhood developments (good or bad) we should know about?
- What's the average days-on-market for RENTAL listings here right now (not sales)? A rising rental-DOM trend means longer vacancies and softer asking-rent achievability than the comps imply.
- What's the recent tenant-quality profile in this submarket — average credit score on applications, eviction rate, late-payment / NSF rate, and stable-employment percentage? A property-management company in the area should have these aggregated.
- How much new apartment / multifamily construction is in the pipeline within 1–3 miles? Heavy new supply (>2% of stock underway) typically softens rents 12–24 months out; light construction supports rent growth.
Investment metrics
- 1% rule
- 0.76% ✗
- Cap rate
- 6.01%
- Cash-on-cash
- -1.02%
- DSCR
- 0.95
- GRM
- 10.9
CMA / ARV
No comps found within radius.
Projected returns pro-forma
-3.0% appreciation · 5.39% rent growth · sell at horizon
- IRR
- -15.6%
- Equity multiple
- 0.43×
- Total profit
- $-3,189,878
- Equity at exit
- $2,996,975
- IRR
- -3.8%
- Equity multiple
- 0.72×
- Total profit
- $-1,564,924
- Equity at exit
- $1,737,881
Cash invested: $5,628,000 (down + closing). Projections, not guarantees.
Landlord ↔ Tenant lean methodology
- Overall (STATE)
- 18 Strongly Tenant-Friendly
- State California
- 18 Strongly Tenant-Friendly · D+13
- County
- — inherits STATE
- City
- — inherits STATE
ZIP-level market 92024
- Rents YoY
- 5.4%
- Active inventory
- 208
- Price-to-rent
- 349.3×
Monthly cashflow live
- Estimated rent
- $153,469 medium interval (Pro) →
- Mortgage (P&I)
- −$105,407
- Tax from tax record
- −$12,249 /mo · $146,984/yr
- Insurance
- −$8,375
- HOA
- −$0
- Vacancy / Maint / Mgmt
- −$32,228
- Net cashflow
- $-4,790
Break-even live
Sensitivity live
| Price | -10% $6,588 | -5% $899 | +0% $-4,790 | +5% $-10,479 | +10% $-16,168 |
|---|---|---|---|---|---|
| Rent | -10% $-16,914 | -5% $-10,852 | +0% $-4,790 | +5% $1,272 | +10% $7,334 |
| Rate | -1.0pp $5,333 | -0.5pp $322 | base $-4,790 | +0.5pp $-9,998 | +1.0pp $-15,297 |
32-unit breakdown (identical units grouped — click to expand)
| Units | Beds | Baths | Est. rent |
|---|---|---|---|
| 32× units | 45 | 45 | $153,472 |
| #1 | 45 | 45 | $4,796 |
| #2 | 45 | 45 | $4,796 |
| #3 | 45 | 45 | $4,796 |
| #4 | 45 | 45 | $4,796 |
| #5 | 45 | 45 | $4,796 |
| #6 | 45 | 45 | $4,796 |
| #7 | 45 | 45 | $4,796 |
| #8 | 45 | 45 | $4,796 |
| #9 | 45 | 45 | $4,796 |
| #10 | 45 | 45 | $4,796 |
| #11 | 45 | 45 | $4,796 |
| #12 | 45 | 45 | $4,796 |
| #13 | 45 | 45 | $4,796 |
| #14 | 45 | 45 | $4,796 |
| #15 | 45 | 45 | $4,796 |
| #16 | 45 | 45 | $4,796 |
| #17 | 45 | 45 | $4,796 |
| #18 | 45 | 45 | $4,796 |
| #19 | 45 | 45 | $4,796 |
| #20 | 45 | 45 | $4,796 |
| #21 | 45 | 45 | $4,796 |
| #22 | 45 | 45 | $4,796 |
| #23 | 45 | 45 | $4,796 |
| #24 | 45 | 45 | $4,796 |
| #25 | 45 | 45 | $4,796 |
| #26 | 45 | 45 | $4,796 |
| #27 | 45 | 45 | $4,796 |
| #28 | 45 | 45 | $4,796 |
| #29 | 45 | 45 | $4,796 |
| #30 | 45 | 45 | $4,796 |
| #31 | 45 | 45 | $4,796 |
| #32 | 45 | 45 | $4,796 |
| Total (32 units) | $153,469 | ||
UW: 25.0% down · 7.5% · 30yr · 1.5% tax · 5.0% vac · 8.0% maint · 8.0% mgmt
Financing live
Cash to close
- Down payment
- $5,025,000
- Closing costs
- $603,000
- Reserves months
- —
- Total cash needed
- —
Loan-product check · same deal, 3 products live
Conventional
25% down · 7.5% · 30yr
- Down + closing
- —
- Monthly P&I
- —
- Monthly cashflow
- —
- DSCR
- —
- Eligible?
- —
Personal DTI + credit; lowest rate.
DSCR
20% down · 8.5% · 30yr
- Down + closing
- —
- Monthly P&I
- —
- Monthly cashflow
- —
- DSCR
- —
- Eligible?
- —
No personal income docs; deal must DSCR.
Hard money
10% down · 12.0% · 12mo
- Down + closing
- —
- Monthly P&I
- —
- Monthly cashflow
- —
- DSCR
- —
- Eligible?
- —
Short-term bridge; refi at stabilization.
Listing history 38 events
-
2026-06-21days on market $20,100,000 Active 48 DOM
-
2026-06-18days on market $20,100,000 Active 45 DOM
-
2026-06-17days on market $20,100,000 Active 44 DOM
-
2026-06-16days on market $20,100,000 Active 43 DOM
-
2026-06-15days on market $20,100,000 Active 42 DOM
-
2026-06-13days on market $20,100,000 Active 40 DOM
-
2026-06-13days on market $20,100,000 Active 39 DOM
-
2026-06-09days on market $20,100,000 Active 36 DOM
-
2026-06-08days on market $20,100,000 Active 35 DOM
-
2026-06-07days on market $20,100,000 Active 34 DOM
-
2026-06-04days on market $20,100,000 Active 31 DOM
-
2026-06-03days on market $20,100,000 Active 30 DOM
-
2026-06-02days on market $20,100,000 Active 29 DOM
-
2026-06-01days on market $20,100,000 Active 28 DOM
-
2026-05-31days on market $20,100,000 Active 27 DOM
-
2026-05-04$20,100,000 Active
-
2025-05-01historical $2,950
-
2025-05-01historical $2,950
-
2025-05-01historical $2,950
-
2025-05-01historical $2,950
-
2025-05-01historical $2,950
-
2025-05-01historical $2,950
-
2025-04-03$2,950
-
2025-04-03$3,050
-
2025-04-03$3,750
-
2025-04-03$3,050
-
2025-04-03$2,900
-
2025-04-03historical $3,850
-
2025-03-08$3,850
-
2025-03-03$3,850
-
2025-02-27historical $2,995
-
2025-02-15price $2,995
-
2025-01-28price $3,150
-
2025-01-25$3,050
-
2023-11-18historical $2,200
-
2023-11-10$2,200
-
2001-11-09soldstatus $3,450,000
-
1986-09-05soldstatus $316,000
ⓘ Source: listings_history table (triggers on properties + properties_extension) + one-shot
backfill from property_details.listing_events for pre-trigger history.
Tax reassessment forecast CA · Resets to sale price
- Current annual tax
- $146,984 · $12,249/mo
- Projected year-2 tax
- $152,760 · $12,730/mo
- Expected delta
- +$5,776/yr (+$481/mo · 3.9%)
ⓘ Screening estimate from a state-policy table — verify with the county assessor before closing.
Climate risk First Street
- Flood 1/10 Low FEMA zone X (unshaded) · 0% chance over 30 yrs
- Wildfire 2/10 Low
- Heat 4/10 Moderate 7 d/yr ≥84°F today · 20 d/yr by 30 yrs out
- Wind 1/10 Low
- Air quality 3/10 Moderate 4 unhealthy d/yr today · 4 by 30 yrs out
Nearby sold comps map
Loading sold comps map…
Walkable amenities ~0.75 mi
Loading nearby amenities…
Taxation est. · year 1
- Rental income
- $1,841,628
- − Mortgage interest
- −$1,125,913
- − Property taxes
- −$146,984
- − Insurance
- −$100,500
- − Repairs & maintenance
- −$147,330
- − Management
- −$147,330
- − Depreciation
- −$584,727
- Taxable loss
- −$411,156
- Est. tax savings @ 24.0%
- +$98,678
- After-tax cash flow
- $41,201/yr
For passive investors: Depreciation is non-cash, so a rental often shows a tax loss while cash-flowing — sheltering income. Rental losses are passive: they offset passive income freely, and up to $25,000/yr can offset ordinary (W-2) income if you actively participate and your MAGI is under $100k (phasing out to $0 by $150k); unused losses carry forward. On sale, claimed depreciation is recaptured at up to 25%, and gains may owe capital-gains tax (a 1031 exchange can defer both). Figures are a year-1 estimate at your 24.0% rate — not tax advice; consult a CPA.
Schools (NCES district)
- District
- San Dieguito Union High
- NCES district ID
- 0634380
- Math proficiency
- 72% ▬ 0.00%
- Reading proficiency
- 79% ▼ -1.00%
- Median HH income
- $110,199
- Composite
- 70.63/100
- National rank
- #519
- State rank
- #56 of 1400 in CA
Livability — Encinitas
- Score
- 79/100
- State rank
- #54
- US rank
- #2026
Category grades
Schools grade is shown separately in the Schools card above.
Census & demographics
- Census place
- Encinitas, CA
- County
- San Diego County · 3,178,799 people
- City population
- 61,717
- Metro
- San Diego-Chula Vista-Carlsbad, CA
- Population (ZIP)
- 50,617
- Household income
- $158,507
- Rent vs Own
- Severe rent burden
- 1537.0
Population outlook (San Diego County) Hauer SSP2
- Today (2025)
- 3,678,185 people
- By 2030
- 3,856,546 · +4.8%
- By 2040
- 4,171,407 · +13.4%
- By 2050
- 4,421,607 · +20.2%
- By 2075
- 4,831,599 · +31.4%
- By 2100
- 4,832,502 · +31.4%
Race, ethnicity, and origin ACS 2023
- Neighborhood character
- Predominantly White (75%)
- Race & ethnicity
- White 75% Hispanic / Latino 14% Two or more races 11% Asian 5%
- Hispanic origin (detail)
- Mexican 10%
- Common ancestry
- Italian 4% Romanian 3% Slovak 3%
- Foreign-born
- 12% · Canada, China
- Languages at home
- 84% English-only · Spanish 9% Other Indo-European 2% German/W. Germanic 1%
Political lean MEDSL · San Diego
- 2024 margin
- D (+16.8) · D 56.9% · R 40.1% · Other 2.9%
- 2008→2024 swing
- +6.6pp toward D · 2008: 10.2pp · 2024: 16.8pp
- All cycles
- 2024: D+16.8 2020: D+22.8 2016: D+17.8 2012: D+5.1 2008: D+10.2
Not yet ingested
- Civics
- —
Market trends
- HPI YoY
- ▼ -881.14%
- Current HPI
- 461.5044
- Rent YoY
- ▲ 5.39%
- Metro
- San Diego-Chula Vista-Carlsbad, CA
- State GDP YoY
- ▲ 3.21%
- F500 in state
- 116
Industry mix (Fortune 500 HQ in CA)
| Industry | F500 HQs | Revenue |
|---|---|---|
| Technology | 27 | $1,492B |
|
||
| Financial Services | 3 | $174B |
|
||
| Retail | 3 | $44B |
|
||
| Insurance | 3 | $26B |
|
||
| Media / Entertainment | 2 | $115B |
|
||
| Pharmaceuticals / Biotech | 2 | $62B |
|
||
Price history
+6260.8% since first listed23 events — show timeline
- 2026-05-04 Listed $20,100,000 SDMLS
- 2025-05-01 Rental Removed $2,950 RENT.
- 2025-05-01 Rental Removed $2,950 RENT.
- 2025-05-01 Rental Removed $2,950 RENT.
- 2025-05-01 Rental Removed $2,950 RENT.
- 2025-05-01 Rental Removed $2,950 RENT.
- 2025-05-01 Rental Removed $2,950 RENT.
- 2025-04-03 Listed for Rent $2,950 RENT.
- 2025-04-03 Listed for Rent $3,050 RENT.
- 2025-04-03 Listed for Rent $3,750 RENT.
- 2025-04-03 Listed for Rent $3,050 RENT.
- 2025-04-03 Listed for Rent $2,900 RENT.
- 2025-04-03 Rental Removed $3,850 RENT.
- 2025-03-08 Listed for Rent $3,850 RENT.
- 2025-03-03 Listed for Rent $3,850 RENT.
- 2025-02-27 Rental Removed $2,995 RENT.
- 2025-02-15 Price Changed $2,995 RENT.
- 2025-01-28 Price Changed $3,150 RENT.
- 2025-01-25 Listed for Rent $3,050 RENT.
- 2023-11-18 Rental Removed $2,200 APPFOLIO
- 2023-11-10 Listed for Rent $2,200 APPFOLIO
- 2001-11-09 Sold (Public Records) $3,450,000 Public Records
- 1986-09-05 Sold (Public Records) $316,000 Public Records
Property tax history
+6.9%/yrLatest (2025): $146,984 · +143.8% YoY. Source: county tax records.
Cash-flow waterfall
monthlySold comps — $/sqft
last 12 mo · ≤1 miLoading sold comps…