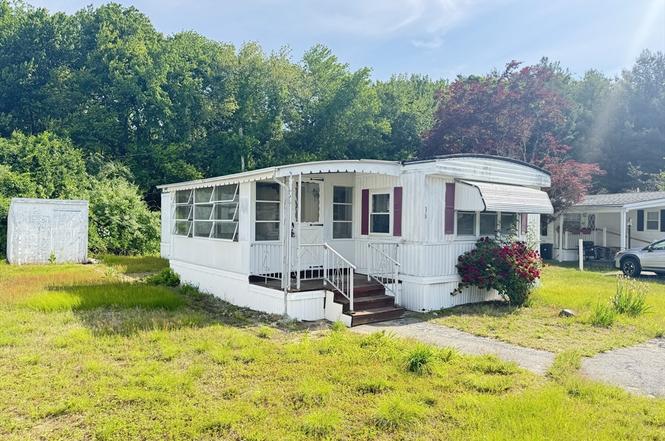
38 Hickory Rd
Taunton, MA 02780
$169,900D
2 bd · 1.0 ba ·
784 sqft ·
Built 1976
· SingleFamily
· Active
· 10 DOM
Cashflow @ list (25.0% down · 7.5%)
Estimated rent
$2,076/mo
Mortgage (P&I)
−$891
Tax + insurance
−$283
HOA
−$480
Vac / Maint / Mgmt
−$436
Net cashflow
$-14/mo
Annual
$-168/yr
Cap rate
6.19%
Cash-on-cash
-0.35%
DSCR
0.98
1% rule
1.22%
Cash to close
$47,572
Investor read
- This is a 2-bed/1.0-bath single-family listed at $170k.
- At list price, monthly cash flow is $-14 ($-168/yr) — negative.
- To cash-flow at today's rent, offer at most $168k (1.2% below list).
- Meets the 1% rule at list price ($2k rent vs $170k).
- Only 10 days on market — expect competitive offers; lowballing is unlikely to land.
- Recommended offer: $168k (1.2% below list) — sets the bar for cash-flow.
- Local home prices are declining (-3.0%/yr); year-one equity from $1k of loan paydown is wiped out by about $5k of value loss. Plan a longer hold.
- Location reads 75/100 on livability (#78 in MA, #4,184 nationally) — a middle-class / working-renter tenant base. Strengths: commute A+, housing A+, health & safety A+; Watch: schools C-, crime C-, amenities F.
- Taunton (suburban): math 19% / reading 36% proficiency, ranked #263 of 302 in MA (top 87%) — low school quality limits family demand, transient renter base, plan for 1-2y turnover.
- Watch-outs: HOA is 23% of rent.
- Market conditions: Rents rising (+2.0%/yr); 75 active listings in the ZIP; 760 units permitted in Bristol County in 2024 (142 in 5+ unit buildings).
- Bristol County population projected to shrink 3% by 2050 — rents likely to lag national; underwrite the cash flow, not the appreciation.
- 2 sale attempts since 31y ago with the ask held roughly flat each time — persistent listings suggest the price (not the market) is what's stuck; bring a comps-based counter.
- Current owner paid $37k; list at $170k implies a 359% gain — meaningful room to come down on a strong offer.
- Climate carrying-cost: major wind risk, 70% chance of damaging wind over 30y; extreme-heat days projected 7→15/yr by 2055 (HVAC capex compounding) — expect insurance premiums to compound above CPI over the hold.
- Cap rate 6.2% vs local median 3.0% in Taunton — top-decile yield for the area; either an underpriced asset or a hidden risk that comps aren't pricing in. Stress-test before assuming the spread holds.
- This rent runs 33% of the median local income ($74k/yr) — at the standard rent-burdened threshold; future hikes will face affordability resistance.
Questions for listing agent
- What do current leases actually rent for vs. the listed asking? Can we see a recent rent roll and the last 12 months of T-12 income?
- Built in 1976 — when were the roof, HVAC, electrical panel, plumbing, and water heater last replaced?
- What does the HOA fee cover, when was the last increase, and are there any pending special assessments or reserve-fund shortfalls?
- Is there a deadline driving the sale (1031 exchange, divorce, estate, relocation)? That informs how much negotiation room exists.
- The area grade is low — what's the realistic commute time and amenity access for the typical tenant pool here? Any planned neighborhood developments (good or bad) we should know about?
- What's the average days-on-market for RENTAL listings here right now (not sales)? A rising rental-DOM trend means longer vacancies and softer asking-rent achievability than the comps imply.
- What's the recent tenant-quality profile in this submarket — average credit score on applications, eviction rate, late-payment / NSF rate, and stable-employment percentage? A property-management company in the area should have these aggregated.
- How much new for-sale + rental construction is in the pipeline within 1–3 miles? Heavy new supply typically softens prices + rents 12–24 months out; constrained supply supports both.
CashFlowRE · CFR-CYZ9DZ89F0GWGS
· Data 1 day ago
cashflowre.app · 2026-05-29