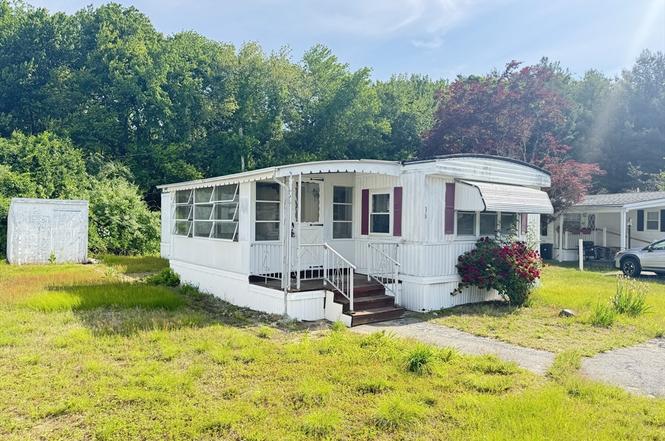
38 Hickory Rd · Taunton, MA
Flood risk 1/10 · Minimal
- FEMA flood zone
- X (unshaded)
- Chance of flooding over 30 yrs
- 0.0%
- Est. flood insurance / yr
- $473 – $860
Fire risk 1/10 · Minimal
- Est. fire insurance / yr
- $915 – $1,699
Heat risk 5/10 · Moderate
- Hot days now (above 97°F)
- 7 days/yr
- Hot days in 30 yrs
- 15 days/yr
Wind risk 6/10 · Moderate
- Chance of severe wind over 30 yrs
- 70.0%
Air-quality risk 2/10 · Minimal
- Unhealthy air days now
- 1 days/yr
- Unhealthy air days in 30 yrs
- 2 days/yr
Risk factors via First Street. Map © Google.
Why this score? — see what drove the D grade
The composite is a weighted blend of 9 inputs, each scored 0–100. Each bar is that input's sub-score; the figure is the points it added to the 100-point composite (weight × sub-score).
- Cash flow +12.9/30.0
- ARV discount +7.5/15.0
- 1% rule +7.2/10.0
- DSCR +3.8/10.0
- Livability +3.8/5.0
- Rent growth +3.0/5.0
- Condition / age +2.5/5.0
- Schools +2.4/10.0
- Appreciation +0.0/10.0
$169,900
🖨 Deal sheet (PDF) 📄 Offer letter ✓ Due diligence
Listing remarks MLS
BEAUTIFUL MOBIL HOME ON CULDESAC! FAM. PARK- PETS ALLOWED. O PEN FLOOR PLAN, EAT IN KIT W/BREAKFAST BAR, NEW OAK KIT & CT FLOOR. ALSO NEW WINDOWS & PORCH C/A. SCREEN RM. OUTDOOR PAT IO. PRK RENT $230
Key facts
- Open floor plan
- Cozy living room
- Remodeled kitchen
Tags
Property features AI
Finance
- HOA & community: Homeowners association membership required; Association fee of $480 (period not specified); Community offers public transportation, shopping, parks, walk/jog trails, medical facility, laundromat, conservation area, highway access and houses of worship
Exterior
- Parking: Paved off-street parking; Two open parking spaces
- Utilities: Public water; Private sewer; Gas available for range and oven; Electric service
- Home design: Mobile home; One-story house; Shingle roof
- Construction: Modular construction; Built by builder (actual year reported)
- Exterior features: Level lot; Private road frontage
Interior
- Kitchen: Range; Refrigerator
- Flooring: Tile; Vinyl; Carpet
- Bathrooms: One full bathroom
- Heating & cooling: Forced air heating (natural gas); Central air conditioning
- Interior features: Four total rooms; Tile, vinyl and carpet flooring
- Laundry & utility: Washer; Dryer
Neighborhood map
What this means for you Summary
Snapshot
- This is a 2-bed/1.0-bath single-family listed at $170k.
Deal economics
- At list price, monthly cash flow is $-14 ($-168/yr) — negative.
- To cash-flow at today's rent, offer at most $168k (1.2% below list).
- Meets the 1% rule at list price ($2k rent vs $170k).
- Recommended offer: $168k (1.2% below list) — sets the bar for cash-flow.
- Cap rate 6.2% vs local median 3.0% in Taunton — top-decile yield for the area; either an underpriced asset or a hidden risk that comps aren't pricing in. Stress-test before assuming the spread holds.
Location & tenants
- Location reads 75/100 on livability (#78 in MA, #4,184 nationally) — a middle-class / working-renter tenant base. Strengths: commute A+, housing A+, health & safety A+; Watch: schools C-, crime C-, amenities F.
- Taunton (suburban): math 19% / reading 36% proficiency, ranked #263 of 302 in MA (top 87%) — low school quality limits family demand, transient renter base, plan for 1-2y turnover.
- Market conditions: Rents rising (+2.0%/yr); 75 active listings in the ZIP; 760 units permitted in Bristol County in 2024 (142 in 5+ unit buildings).
- This rent runs 33% of the median local income ($74k/yr) — at the standard rent-burdened threshold; future hikes will face affordability resistance.
Forward outlook
- Local home prices are declining (-3.0%/yr); year-one equity from $1k of loan paydown is wiped out by about $5k of value loss. Plan a longer hold.
- Bristol County population projected to shrink 3% by 2050 — rents likely to lag national; underwrite the cash flow, not the appreciation.
Negotiation context
- Only 10 days on market — expect competitive offers; lowballing is unlikely to land.
- 2 sale attempts since 31y ago with the ask held roughly flat each time — persistent listings suggest the price (not the market) is what's stuck; bring a comps-based counter.
- Current owner paid $37k; list at $170k implies a 359% gain — meaningful room to come down on a strong offer.
Risks & watch-outs
- Watch-outs: HOA is 23% of rent.
- Climate carrying-cost: major wind risk, 70% chance of damaging wind over 30y; extreme-heat days projected 7→15/yr by 2055 (HVAC capex compounding) — expect insurance premiums to compound above CPI over the hold.
Questions for the listing agent
- What do current leases actually rent for vs. the listed asking? Can we see a recent rent roll and the last 12 months of T-12 income?
- Built in 1976 — when were the roof, HVAC, electrical panel, plumbing, and water heater last replaced?
- What does the HOA fee cover, when was the last increase, and are there any pending special assessments or reserve-fund shortfalls?
- Is there a deadline driving the sale (1031 exchange, divorce, estate, relocation)? That informs how much negotiation room exists.
- The area grade is low — what's the realistic commute time and amenity access for the typical tenant pool here? Any planned neighborhood developments (good or bad) we should know about?
- What's the average days-on-market for RENTAL listings here right now (not sales)? A rising rental-DOM trend means longer vacancies and softer asking-rent achievability than the comps imply.
- What's the recent tenant-quality profile in this submarket — average credit score on applications, eviction rate, late-payment / NSF rate, and stable-employment percentage? A property-management company in the area should have these aggregated.
- How much new for-sale + rental construction is in the pipeline within 1–3 miles? Heavy new supply typically softens prices + rents 12–24 months out; constrained supply supports both.
Investment metrics
- 1% rule
- 1.22% ✓
- Cap rate
- 6.19%
- Cash-on-cash
- -0.35%
- DSCR
- 0.98
- GRM
- 6.8
CMA / ARV
No comps found within radius.
Projected returns pro-forma
-3.0% appreciation · 2.0% rent growth · sell at horizon
- IRR
- -18.2%
- Equity multiple
- 0.37×
- Total profit
- $-30,163
- Equity at exit
- $25,333
- IRR
- -13.0%
- Equity multiple
- 0.28×
- Total profit
- $-34,404
- Equity at exit
- $14,690
Cash invested: $47,572 (down + closing). Projections, not guarantees.
Landlord ↔ Tenant lean methodology
- Overall (STATE)
- 20 Strongly Tenant-Friendly
- State Massachusetts
- 20 Strongly Tenant-Friendly · D+15
- County
- — inherits STATE
- City
- — inherits STATE
ZIP-level market 02780
- Home prices YoY
- -28.1%
- Rents YoY
- 2.0%
- Active inventory
- 75
- Price-to-rent
- 6.8×
Monthly cashflow live
- Estimated rent
- $2,076 medium interval (Pro) →
- Mortgage (P&I)
- −$891
- Tax est. 1.5%
- −$212 /mo · $2,548/yr
- Insurance
- −$71
- HOA
- −$480
- Vacancy / Maint / Mgmt
- −$436
- Net cashflow
- $-14
Break-even live
Sensitivity live
| Price | -10% $103 | -5% $45 | +0% $-14 | +5% $-73 | +10% $-131 |
|---|---|---|---|---|---|
| Rent | -10% $-178 | -5% $-96 | +0% $-14 | +5% $68 | +10% $150 |
| Rate | -1.0pp $72 | -0.5pp $29 | base $-14 | +0.5pp $-58 | +1.0pp $-103 |
UW: 25.0% down · 7.5% · 30yr · 1.5% tax · 5.0% vac · 8.0% maint · 8.0% mgmt
Financing live
Cash to close
- Down payment
- $42,475
- Closing costs
- $5,097
- Reserves months
- —
- Total cash needed
- —
Loan-product check · same deal, 3 products live
Conventional
25% down · 7.5% · 30yr
- Down + closing
- —
- Monthly P&I
- —
- Monthly cashflow
- —
- DSCR
- —
- Eligible?
- —
Personal DTI + credit; lowest rate.
DSCR
20% down · 8.5% · 30yr
- Down + closing
- —
- Monthly P&I
- —
- Monthly cashflow
- —
- DSCR
- —
- Eligible?
- —
No personal income docs; deal must DSCR.
Hard money
10% down · 12.0% · 12mo
- Down + closing
- —
- Monthly P&I
- —
- Monthly cashflow
- —
- DSCR
- —
- Eligible?
- —
Short-term bridge; refi at stabilization.
HOA detail
- Monthly dues
- $480 · $5,760/yr
Listing history 8 events
-
2026-06-21days on market $169,900 Active 10 DOM
-
2026-06-18days on market $169,900 Active 7 DOM
-
2026-06-17days on market $169,900 Active 6 DOM
-
2026-06-16days on market $169,900 Active 5 DOM
-
2026-06-15statusdays on market $169,900 Active 4 DOM
-
2026-06-13days on market $169,900 New 2 DOM
-
2026-06-13remarks 699-char remark
-
2026-06-13$169,900 New 1 DOM
ⓘ Source: listings_history table (triggers on properties + properties_extension) + one-shot
backfill from property_details.listing_events for pre-trigger history.
Climate risk First Street
- Flood 1/10 Low FEMA zone X (unshaded) · 0% chance over 30 yrs
- Wildfire 1/10 Low
- Heat 5/10 Major 7 d/yr ≥97°F today · 15 d/yr by 30 yrs out
- Wind 6/10 Major 70% chance of damaging wind over 30 yrs
- Air quality 2/10 Low 1 unhealthy d/yr today · 2 by 30 yrs out
Nearby sold comps map
Loading sold comps map…
Walkable amenities ~0.75 mi
Loading nearby amenities…
Taxation est. · year 1
- Rental income
- $24,914
- − Mortgage interest
- −$9,517
- − Property taxes
- −$2,548
- − Insurance
- −$850
- − Repairs & maintenance
- −$1,993
- − Management
- −$1,993
- − HOA
- −$5,760
- − Depreciation
- −$4,943
- Taxable loss
- −$2,690
- Est. tax savings @ 24.0%
- +$646
- After-tax cash flow
- $478/yr
For passive investors: Depreciation is non-cash, so a rental often shows a tax loss while cash-flowing — sheltering income. Rental losses are passive: they offset passive income freely, and up to $25,000/yr can offset ordinary (W-2) income if you actively participate and your MAGI is under $100k (phasing out to $0 by $150k); unused losses carry forward. On sale, claimed depreciation is recaptured at up to 25%, and gains may owe capital-gains tax (a 1031 exchange can defer both). Figures are a year-1 estimate at your 24.0% rate — not tax advice; consult a CPA.
Schools (NCES district)
- District
- Taunton
- NCES district ID
- 2511520
- Math proficiency
- 19% ▼ -16.00%
- Reading proficiency
- 36% ▼ -2.00%
- Median HH income
- $54,102
- Composite
- 24.46/100
- National rank
- #7665
- State rank
- #263 of 302 in MA
Livability — Taunton
- Score
- 75/100
- State rank
- #78
- US rank
- #4184
Category grades
Schools grade is shown separately in the Schools card above.
Census & demographics
- Census place
- Taunton, MA
- County
- Bristol County · 342,083 people
- City population
- 53,461
- Metro
- Providence-Warwick, RI-MA
- Population (ZIP)
- 53,461
- Household income
- $74,471
- Rent vs Own
- Severe rent burden
- 2508.0
Population outlook (Bristol County) Hauer SSP2
- Today (2025)
- 570,212 people
- By 2030
- 571,181 · +0.2%
- By 2040
- 565,389 · -0.8%
- By 2050
- 552,141 · -3.2%
- By 2075
- 520,923 · -8.6%
- By 2100
- 474,363 · -16.8%
Race, ethnicity, and origin ACS 2023
- Neighborhood character
- Predominantly White (70%)
- Race & ethnicity
- White 70% Two or more races 15% Hispanic / Latino 10% Black 7% Asian 2%
- Hispanic origin (detail)
- Puerto Rican 7% Dominican 1%
- Common ancestry
- Russian 19% Lithuanian 6% Romanian 3%
- Foreign-born
- 14% · Canada, Vietnam
- Languages at home
- 78% English-only · Other Indo-European 11% Spanish 6% French/Haitian/Cajun 3%
Political lean MEDSL · Bristol
- 2024 margin
- Toss-up / Even · D 49.8% · R 48.5% · Other 1.8%
- 2008→2024 swing
- -21.9pp toward R · 2008: 23.2pp · 2024: 1.3pp
- All cycles
- 2024: D+1.3 2020: D+12.0 2016: D+9.3 2012: D+20.5 2008: D+23.2
Not yet ingested
- Civics
- —
Market trends
- HPI YoY
- ▼ -124.79%
- Current HPI
- 319.3662
- Rent YoY
- ▲ 2.00%
- Metro
- Providence-Warwick, RI-MA
- State GDP YoY
- ▲ 2.28%
- F500 in state
- 38
Industry mix (Fortune 500 HQ in MA)
| Industry | F500 HQs | Revenue |
|---|---|---|
| Technology | 3 | $17B |
|
||
| Insurance | 2 | $84B |
|
||
| Retail | 2 | $76B |
|
||
| Life Sciences | 1 | $43B |
|
||
| Energy Technology | 1 | $31B |
|
||
| Aerospace / Defense | 1 | $18B |
|
||
Price history
+305.5% since first listed3 events — show timeline
- 2026-06-11 Listed $169,900 MLS PIN
- 1996-01-21 Sold (MLS) $37,000 MLS PIN
- 1995-07-31 Listed $41,900 MLS PIN
Cash-flow waterfall
monthlySold comps — $/sqft
last 12 mo · ≤1 miLoading sold comps…