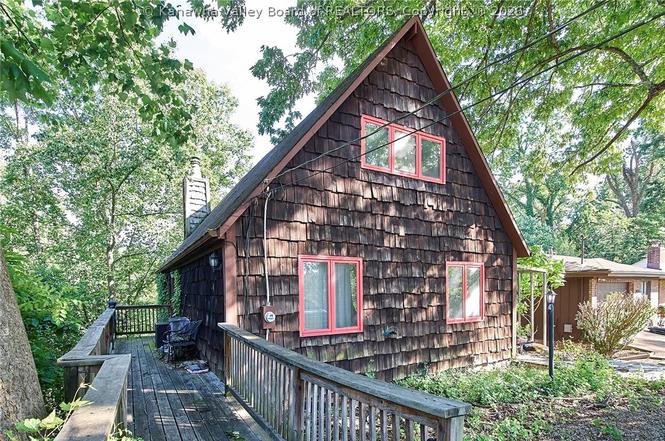
1553 Loudon Heights Rd
Charleston, WV 25314
$110,000C+
3 bd · 3.0 ba ·
2,232 sqft ·
Built 1981
· SingleFamily
· Active
· 2 DOM
Cashflow @ list (25.0% down · 7.5%)
Estimated rent
$1,361/mo
Mortgage (P&I)
−$577
Tax + insurance
−$192
HOA
−$0
Vac / Maint / Mgmt
−$286
Net cashflow
$306/mo
Annual
$3,676/yr
Cap rate
9.63%
Cash-on-cash
11.93%
DSCR
1.53
1% rule
1.24%
Cash to close
$30,800
Investor read
- This is a 3-bed/3.0-bath single-family listed at $110k.
- At list price, monthly cash flow is $306 ($4k/yr) — positive.
- The deal already cash-flows at list — no discount required.
- Meets the 1% rule at list price ($1k rent vs $110k).
- Only 2 days on market — expect competitive offers; lowballing is unlikely to land.
- Local home prices are declining (-3.0%/yr); year-one equity from $761 of loan paydown is wiped out by about $3k of value loss. Plan a longer hold.
- Location reads 85/100 on livability (#3 in WV, #524 nationally) — a professional / high-income tenant draw. Strengths: amenities A+, commute A+, cost of living A+; Watch: crime F.
- Kanawha County Schools (suburban): math 29% / reading 40% proficiency, ranked #17 of 55 in WV (top 31%) — families likely to look elsewhere, expect single-tenant / working-renter base with shorter leases.
- Zoned schools: Holz Elementary School (math 72% / reading 77%, grade A, #4 of 377 statewide, top 1%, 278 students, 0% FRL); John Adams Middle School (math 45% / reading 63%, grade B-, #2 of 109 statewide, top 1%, 705 students, 0% FRL) — zoned schools average 0% FRL vs 46% district-wide (46 pts lower); this property's tenant base skews higher-income than the district average.
- Zoned-school proficiency averages 64% at this address vs 34% district-wide (+30 pts) — the actual schools serving this property are materially stronger than the Kanawha County Schools average implies; a family-tenant draw the district grade alone would hide.
- Market conditions: 115 active listings in the ZIP; 103 units permitted in Kanawha County in 2024 (0 in 5+ unit buildings).
- Kanawha County population projected at -17% by 2050 — secular population decline; favor cash flow + early exit over multi-decade hold.
- At projected returns (-3.0% appreciation + 3.0% rent growth), your $31k cash investment doubles in ~10 years — after that, you're playing with house money.
- Cap rate 9.6% vs local median 3.8% in Charleston — top-decile yield for the area; either an underpriced asset or a hidden risk that comps aren't pricing in. Stress-test before assuming the spread holds.
Questions for listing agent
- Is there a deadline driving the sale (1031 exchange, divorce, estate, relocation)? That informs how much negotiation room exists.
- Schools are A-rated — typically a magnet for longer-tenancy family renters. What's the average tenant stay here, and is there a school-zone premium baked into asking?
- Crime grade is F in this area — have there been break-ins, vandalism, or insurance claims at this property in the last 3 years? What carrier currently insures it and at what premium?
- What's the average days-on-market for RENTAL listings here right now (not sales)? A rising rental-DOM trend means longer vacancies and softer asking-rent achievability than the comps imply.
- What's the recent tenant-quality profile in this submarket — average credit score on applications, eviction rate, late-payment / NSF rate, and stable-employment percentage? A property-management company in the area should have these aggregated.
- How much new for-sale + rental construction is in the pipeline within 1–3 miles? Heavy new supply typically softens prices + rents 12–24 months out; constrained supply supports both.
CashFlowRE · CFR-CZ2MS8EZM398JC
· Data 1 day ago
cashflowre.app · 2026-05-29