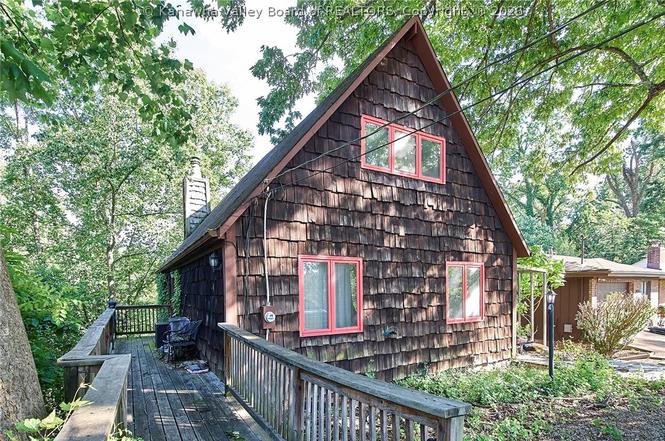
1553 Loudon Heights Rd · Charleston, WV
Flood risk 1/10 · Minimal
- FEMA flood zone
- X (unshaded)
- Chance of flooding over 30 yrs
- 0.0%
- Est. flood insurance / yr
- $473 – $860
Fire risk 4/10 · Minor
- Est. fire insurance / yr
- $787 – $1,461
Heat risk 4/10 · Minor
- Hot days now (above 100°F)
- 7 days/yr
- Hot days in 30 yrs
- 18 days/yr
Wind risk 2/10 · Minimal
- Chance of severe wind over 30 yrs
- 1.0%
Air-quality risk 1/10 · Minimal
- Unhealthy air days now
- 0 days/yr
- Unhealthy air days in 30 yrs
- 0 days/yr
Risk factors via First Street. Map © Google.
Why this score? — see what drove the C+ grade
The composite is a weighted blend of 9 inputs, each scored 0–100. Each bar is that input's sub-score; the figure is the points it added to the 100-point composite (weight × sub-score).
- Cash flow +27.0/30.0
- DSCR +9.3/10.0
- ARV discount +7.5/15.0
- 1% rule +7.4/10.0
- Livability +4.2/5.0
- Schools +2.9/10.0
- Rent growth +2.5/5.0
- Condition / age +2.5/5.0
- Appreciation +0.0/10.0
$110,000
🖨 Deal sheet 📄 Offer letter ✓ Due diligence
Listing remarks
Rare opportunity in desirable South Hills! This 3-bedroom, 3-bath home offers generous space, a functional layout, and incredible potential for investors or buyers looking to build equity. The property provides the perfect canvas to bring your vision to life. Conveniently located just minutes from downtown Charleston, this home combines a sought-after location with endless possibilities. Renovate, refresh, and reap the rewards!
Key facts
- Generous space
- Functional layout
- 0.25 acre lot
Tags
Property features AI
Exterior
- Parking: Parking pad
- Utilities: Public water; Public sewer; Cable available
- Home design: Single-family residence; Residential property
- Construction: Frame construction; Composition/shingle roof
- Exterior features: Deck; Wooded lot
Interior
- Kitchen: Dishwasher; Electric range; Garbage disposal; Refrigerator
- Flooring: Carpet; Hardwood
- Bathrooms: 3 full bathrooms
- Heating & cooling: Central air conditioning; Electric forced-air heating
- Interior features: Eat-in kitchen; Insulated windows; Full basement
Neighborhood map
What this means for you Summary
Snapshot
- This is a 3-bed/3.0-bath single-family listed at $110k.
Deal economics
- At list price, monthly cash flow is $306 ($4k/yr) — positive.
- The deal already cash-flows at list — no discount required.
- Meets the 1% rule at list price ($1k rent vs $110k).
- Cap rate 9.6% vs local median 3.8% in Charleston — top-decile yield for the area; either an underpriced asset or a hidden risk that comps aren't pricing in. Stress-test before assuming the spread holds.
Location & tenants
- Location reads 85/100 on livability (#3 in WV, #524 nationally) — a professional / high-income tenant draw. Strengths: amenities A+, commute A+, cost of living A+; Watch: crime F.
- Kanawha County Schools (suburban): math 29% / reading 40% proficiency, ranked #17 of 55 in WV (top 31%) — families likely to look elsewhere, expect single-tenant / working-renter base with shorter leases.
- Zoned schools: Holz Elementary School (math 72% / reading 77%, grade A, #4 of 377 statewide, top 1%, 278 students, 0% FRL); John Adams Middle School (math 45% / reading 63%, grade B-, #2 of 109 statewide, top 1%, 705 students, 0% FRL) — zoned schools average 0% FRL vs 46% district-wide (46 pts lower); this property's tenant base skews higher-income than the district average.
- Zoned-school proficiency averages 64% at this address vs 34% district-wide (+30 pts) — the actual schools serving this property are materially stronger than the Kanawha County Schools average implies; a family-tenant draw the district grade alone would hide.
- Market conditions: 115 active listings in the ZIP; 103 units permitted in Kanawha County in 2024 (0 in 5+ unit buildings).
Forward outlook
- Local home prices are declining (-3.0%/yr); year-one equity from $761 of loan paydown is wiped out by about $3k of value loss. Plan a longer hold.
- Kanawha County population projected at -17% by 2050 — secular population decline; favor cash flow + early exit over multi-decade hold.
- At projected returns (-3.0% appreciation + 3.0% rent growth), your $31k cash investment doubles in ~10 years — after that, you're playing with house money.
Negotiation context
- Only 2 days on market — expect competitive offers; lowballing is unlikely to land.
Questions for the listing agent
- Is there a deadline driving the sale (1031 exchange, divorce, estate, relocation)? That informs how much negotiation room exists.
- Schools are A-rated — typically a magnet for longer-tenancy family renters. What's the average tenant stay here, and is there a school-zone premium baked into asking?
- Crime grade is F in this area — have there been break-ins, vandalism, or insurance claims at this property in the last 3 years? What carrier currently insures it and at what premium?
- What's the average days-on-market for RENTAL listings here right now (not sales)? A rising rental-DOM trend means longer vacancies and softer asking-rent achievability than the comps imply.
- What's the recent tenant-quality profile in this submarket — average credit score on applications, eviction rate, late-payment / NSF rate, and stable-employment percentage? A property-management company in the area should have these aggregated.
- How much new for-sale + rental construction is in the pipeline within 1–3 miles? Heavy new supply typically softens prices + rents 12–24 months out; constrained supply supports both.
Investment metrics
- 1% rule
- 1.24% ✓
- Cap rate
- 9.63%
- Cash-on-cash
- 11.93%
- DSCR
- 1.53
- GRM
- 6.7
CMA / ARV
- ARV (on-the-fly)
- $308,016
- Comps found
- 12
Show comp detail 12 sales within ~0.75 mi
| Address | Dist | Beds/Ba | Sqft | Sold | Price | $/sf | Match |
|---|---|---|---|---|---|---|---|
| 1530 Loudon Heights Rd | 0.15mi | 4/3.0 (+1) | 2,186 (-2%) | 1mo | $360,000 | $165 | 84 |
| 1527 Hampton Rd | 0.52mi | 3/3.0 | 2,300 (+3%) | 10mo | $289,000 | $126 | 62 |
| 1418 Sweetbrier Rd | 0.53mi | 4/2.5 (+1) | 2,274 (+2%) | 12mo | $350,000 | $154 | 55 |
| 424 Porter Rd | 0.68mi | 3/2.0 | 2,273 (+2%) | 7mo | $215,000 | $95 | 55 |
| 5 Estill Dr | 0.55mi | 3/2.0 | 2,060 (-8%) | 4mo | $76,880 | $37 | 54 |
| 140 Abney Cir | 0.74mi | 3/2.5 | 2,165 (-3%) | 7mo | $359,000 | $166 | 52 |
| 1504 Bedford Rd | 0.74mi | 4/2.0 (+1) | 2,289 (+3%) | 1mo | $330,000 | $144 | 51 |
| 1524 Hampton Rd | 0.48mi | 3/3.0 | 2,527 (+13%) | 7mo | $458,000 | $181 | 50 |
| 1417 Longridge Rd | 0.73mi | 3/2.5 | 2,190 (-2%) | 14mo | $290,000 | $132 | 50 |
| 408 Rock Holly Rd | 0.62mi | 3/2.5 | 2,099 (-6%) | 17mo | $285,000 | $136 | 45 |
| 1 Estill Dr | 0.55mi | 3/3.5 | 2,000 (-10%) | 14mo | $275,000 | $138 | 44 |
| 442 Porter Rd | 0.64mi | 4/2.0 (+1) | 2,112 (-5%) | 10mo | $195,500 | $93 | 43 |
Match score weights: distance 35% · size 25% · config 20% · recency 20%. Top-matched comps best support the ARV.
Projected returns pro-forma
-3.0% appreciation · 3.0% rent growth · sell at horizon
- IRR
- 1.5%
- Equity multiple
- 1.06×
- Total profit
- $1,710
- Equity at exit
- $16,401
- IRR
- 11.1%
- Equity multiple
- 1.87×
- Total profit
- $26,714
- Equity at exit
- $9,511
Cash invested: $30,800 (down + closing). Projections, not guarantees.
Landlord ↔ Tenant lean methodology
- Overall (STATE)
- 83 Strongly Landlord-Friendly
- State West Virginia
- 83 Strongly Landlord-Friendly · R+22
- County
- — inherits STATE
- City
- — inherits STATE
ZIP-level market 25314
- Home prices YoY
- -32.9%
- Active inventory
- 115
- Price-to-rent
- 6.7×
Monthly cashflow live
- Estimated rent
- $1,361 medium interval (Pro) →
- Mortgage (P&I)
- −$577
- Tax from tax record
- −$146 /mo · $1,750/yr
- Insurance
- −$46
- HOA
- −$0
- Vacancy / Maint / Mgmt
- −$286
- Net cashflow
- $306
Break-even live
UW: 25.0% down · 7.5% · 30yr · 1.5% tax · 5.0% vac · 8.0% maint · 8.0% mgmt
Financing live
Cash to close
- Down payment
- $27,500
- Closing costs
- $3,300
- Reserves months
- —
- Total cash needed
- —
Loan-product check · same deal, 3 products live
Conventional
25% down · 7.5% · 30yr
- Down + closing
- —
- Monthly P&I
- —
- Monthly cashflow
- —
- DSCR
- —
- Eligible?
- —
Personal DTI + credit; lowest rate.
DSCR
20% down · 8.5% · 30yr
- Down + closing
- —
- Monthly P&I
- —
- Monthly cashflow
- —
- DSCR
- —
- Eligible?
- —
No personal income docs; deal must DSCR.
Hard money
10% down · 12.0% · 12mo
- Down + closing
- —
- Monthly P&I
- —
- Monthly cashflow
- —
- DSCR
- —
- Eligible?
- —
Short-term bridge; refi at stabilization.
Listing history 3 events
-
2026-06-19days on market $110,000 Active 2 DOM
-
2026-06-17remarks 431-char remark
-
2026-06-17$110,000 Active 1 DOM
ⓘ Source: listings_history table (triggers on properties + properties_extension) + one-shot
backfill from property_details.listing_events for pre-trigger history.
Tax reassessment forecast WV · Resets to sale price
- Current annual tax
- $1,750 · $146/mo
- Projected year-2 tax
- $1,750 · $146/mo
- Expected delta
- $0/yr ($0/mo · 0.0%)
ⓘ Screening estimate from a state-policy table — verify with the county assessor before closing.
Climate risk First Street
- Flood 1/10 Low FEMA zone X (unshaded) · 0% chance over 30 yrs
- Wildfire 4/10 Moderate
- Heat 4/10 Moderate 7 d/yr ≥100°F today · 18 d/yr by 30 yrs out
- Wind 2/10 Low 100% chance of damaging wind over 30 yrs
- Air quality 1/10 Low 0 unhealthy d/yr today · 0 by 30 yrs out
Nearby sold comps map
Loading sold comps map…
Walkable amenities ~0.75 mi
Loading nearby amenities…
Taxation est. · year 1
- Rental income
- $16,327
- − Mortgage interest
- −$6,162
- − Property taxes
- −$1,750
- − Insurance
- −$550
- − Repairs & maintenance
- −$1,306
- − Management
- −$1,306
- − Depreciation
- −$3,200
- Taxable income
- $2,053
- Est. tax owed @ 24.0%
- −$493
- After-tax cash flow
- $3,183/yr
For passive investors: Depreciation is non-cash, so a rental often shows a tax loss while cash-flowing — sheltering income. Rental losses are passive: they offset passive income freely, and up to $25,000/yr can offset ordinary (W-2) income if you actively participate and your MAGI is under $100k (phasing out to $0 by $150k); unused losses carry forward. On sale, claimed depreciation is recaptured at up to 25%, and gains may owe capital-gains tax (a 1031 exchange can defer both). Figures are a year-1 estimate at your 24.0% rate — not tax advice; consult a CPA.
Schools (NCES district)
- District
- Kanawha County Schools
- NCES district ID
- 5400600
- Math proficiency
- 29% ▼ -13.00%
- Reading proficiency
- 40% ▼ -7.00%
- Median HH income
- $44,329
- Composite
- 29.35/100
- National rank
- #6540
- State rank
- #17 of 55 in WV
Livability — Charleston
- Score
- 85/100
- State rank
- #3
- US rank
- #524
Category grades
Schools grade is shown separately in the Schools card above.
Census & demographics
- Census place
- Charleston, WV
- City population
- 33,502
- Population (ZIP)
- 15,742
Population outlook (Kanawha County) Hauer SSP2
- Today (2025)
- 178,946 people
- By 2030
- 172,906 · -3.4%
- By 2040
- 159,874 · -10.7%
- By 2050
- 148,148 · -17.2%
- By 2075
- 123,257 · -31.1%
- By 2100
- 96,454 · -46.1%
Race, ethnicity, and origin ACS 2023
- Neighborhood character
- Predominantly White (85%)
- Race & ethnicity
- White 85% Two or more races 5% Asian 5% Black 4% Hispanic / Latino 2%
- Common ancestry
- Slovak 3% Serbian 3% Lithuanian 3%
- Foreign-born
- 5% · China, Canada
- Languages at home
- 93% English-only · Other Indo-European 3% Spanish 2% Other Asian/Pacific 1%
Political lean MEDSL · Kanawha
- 2024 margin
- R (+17.4) · D 40.2% · R 57.6% · Other 2.2%
- 2008→2024 swing
- -17.0pp toward R · 2008: -0.4pp · 2024: -17.4pp
- All cycles
- 2024: R+17.4 2020: R+14.7 2016: R+20.6 2012: R+11.9 2008: R+0.4
Not yet ingested
- Civics
- —
Market trends
- HPI YoY
- ▼ -80.67%
- Current HPI
- 164.9358
- Rent YoY
- —
- Metro
- —
- State GDP YoY
- —
- F500 in state
- 0
Price history
+23.6% since first listed3 events — show timeline
- 2026-06-17 Listed $110,000 KVBOR
- 2008-04-10 Sold (Public Records) $129,800 Public Records
- 1994-10-03 Sold (Public Records) $89,000 Public Records
Property tax history
+2.0%/yrLatest (2025): $1,750 · -1.0% YoY. Source: county tax records.
Cash-flow waterfall
monthlySold comps — $/sqft
last 12 mo · ≤1 miLoading sold comps…