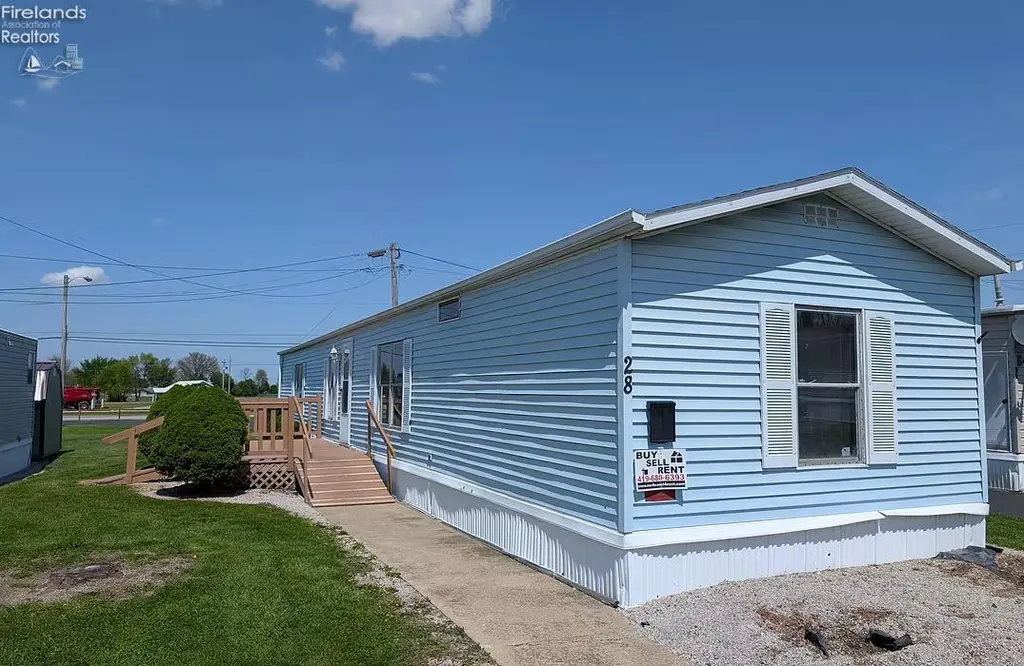
1420 E Main St #28
Bellevue, OH 44811
$37,900D
2 bd · 1.0 ba ·
938 sqft ·
Built 1986
· Manufactured
· Active
· 35 DOM
Cashflow @ list (25.0% down · 7.5%)
Estimated rent
$817/mo
Mortgage (P&I)
−$199
Tax + insurance
−$63
HOA
−$415
Vac / Maint / Mgmt
−$172
Net cashflow
$-32/mo
Annual
$-379/yr
Cap rate
5.29%
Cash-on-cash
-3.57%
DSCR
0.84
1% rule
2.16%
Cash to close
$10,612
Investor read
- This is a 2-bed/1.0-bath manufactured listed at $38k.
- At list price, monthly cash flow is $-32 ($-379/yr) — negative.
- To cash-flow at today's rent, offer at most $33k (12.1% below list).
- Meets the 1% rule at list price ($817 rent vs $38k).
- It's been on market 35 days — a 3% lower offer ($37k) is reasonable based on typical stale-listing flexibility.
- Recommended offer: $33k (12.1% below list) — sets the bar for cash-flow.
- Local home prices are declining (-3.0%/yr); year-one equity from $262 of loan paydown is wiped out by about $1k of value loss. Plan a longer hold.
- Location reads 77/100 on livability (#181 in OH, #2,807 nationally) — a middle-class / working-renter tenant base. Strengths: cost of living A+, housing A+, health & safety A+; Watch: amenities F, commute F.
- Bellevue City (town): math 56% / reading 65% proficiency, ranked #280 of 656 in OH (top 43%) — acceptable for families but not a draw, mixed tenant base, ~2y average lease.
- Zoned schools: Bellevue Elementary School (math 66% / reading 63%, grade B, #522 of 1,584 statewide, top 36%, 866 students, 44% FRL); Bellevue Middle School (math 53% / reading 64%, grade B, #287 of 654 statewide, top 45%, 416 students, 37% FRL); Bellevue High School (math 32% / reading 72%, grade D+, #343 of 781 statewide, top 47%, 534 students, 33% FRL).
- Watch-outs: HOA is 51% of rent.
- Market conditions: 45 active listings in the ZIP; 40 units permitted in Huron County in 2024 (0 in 5+ unit buildings).
- Huron County population projected at -22% by 2050 — secular population decline; favor cash flow + early exit over multi-decade hold.
- Cap rate 5.3% vs local median 3.2% in Bellevue — top-decile yield for the area; either an underpriced asset or a hidden risk that comps aren't pricing in. Stress-test before assuming the spread holds.
- This rent is only 15% of the median local income ($64k/yr) — well below the 30% rent-burden line; pricing power to push rent on renewal without tenant pushback.
Questions for listing agent
- What do current leases actually rent for vs. the listed asking? Can we see a recent rent roll and the last 12 months of T-12 income?
- It's been on market 35 days. Have you received any prior offers? Is the seller open to a 12% concession, seller financing, or rate buy-down credit?
- What does the HOA fee cover, when was the last increase, and are there any pending special assessments or reserve-fund shortfalls?
- Is there a deadline driving the sale (1031 exchange, divorce, estate, relocation)? That informs how much negotiation room exists.
- Schools are A-rated — typically a magnet for longer-tenancy family renters. What's the average tenant stay here, and is there a school-zone premium baked into asking?
- The area grade is low — what's the realistic commute time and amenity access for the typical tenant pool here? Any planned neighborhood developments (good or bad) we should know about?
- What's the average days-on-market for RENTAL listings here right now (not sales)? A rising rental-DOM trend means longer vacancies and softer asking-rent achievability than the comps imply.
- What's the recent tenant-quality profile in this submarket — average credit score on applications, eviction rate, late-payment / NSF rate, and stable-employment percentage? A property-management company in the area should have these aggregated.
CashFlowRE · CFR-D3XFJ64ZJ1KB7B
· Data 2 h ago
cashflowre.app · 2026-05-29