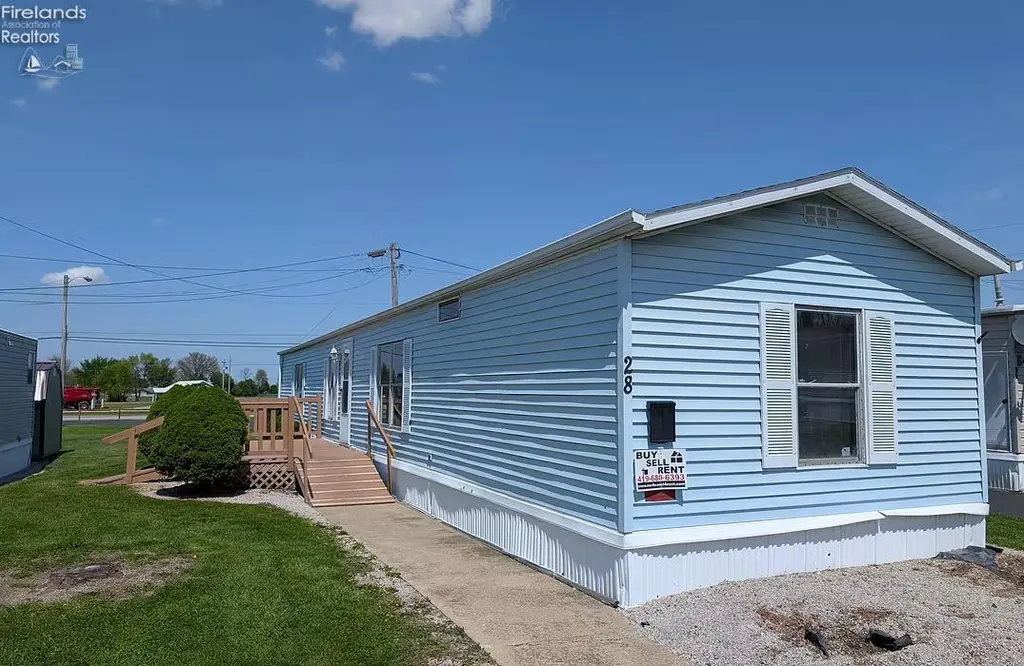
1420 E Main St #28 · Bellevue, OH
Flood risk 1/10 · Minimal
- FEMA flood zone
- X (unshaded)
- Chance of flooding over 30 yrs
- 0.0%
- Est. flood insurance / yr
- $507 – $1,088
Fire risk 1/10 · Minimal
- Est. fire insurance / yr
- $713 – $1,323
Heat risk 3/10 · Minor
- Hot days now (above 98°F)
- 7 days/yr
- Hot days in 30 yrs
- 17 days/yr
Wind risk 1/10 · Minimal
- Chance of severe wind over 30 yrs
- —
Air-quality risk 3/10 · Minor
- Unhealthy air days now
- 2 days/yr
- Unhealthy air days in 30 yrs
- 4 days/yr
Risk factors via First Street. Map © Google.
Why this score? — see what drove the D grade
The composite is a weighted blend of 9 inputs, each scored 0–100. Each bar is that input's sub-score; the figure is the points it added to the 100-point composite (weight × sub-score).
- 1% rule +10.0/10.0
- Cash flow +8.7/30.0
- ARV discount +7.5/15.0
- Schools +5.2/10.0
- Livability +3.9/5.0
- Rent growth +2.5/5.0
- Condition / age +2.5/5.0
- DSCR +2.4/10.0
- Appreciation +0.0/10.0
$37,900
🖨 Deal sheet (PDF) 📄 Offer letter ✓ Due diligence
Listing remarks
Agent is OwnerNEW STOVE AND FRIDGE, ALL NEW CARPET and PLANK FLOORING throughout. newly remodeled walk-in shower in Master Bath. Ramped entryNew water heater. Mobile Home Parklot rent is $415/mo. REQUIRES: Security deposit, 1st month's rent, photo ID for all residents age 18+, and Property Insurance as specified in the Lease Agreement.
Key facts
- New stove and fridge
- New water-heater
- New carpet
Tags
Property features AI
Finance
- Other: Listed by Next Level Realty, LLC
- HOA & community: Homeowners association with a $415 monthly fee
Exterior
- Utilities: Public water; Public sewer
- Home design: Residential mobile home; Lot located in Section 3, near Route 20
- Construction: Vinyl siding
- Exterior features: Fiberglass roof
Interior
- Kitchen: Range; Refrigerator
- Bedrooms: 5 total rooms (includes bedrooms and living spaces)
- Bathrooms: 1 full bathroom; 1 half bathroom
- Heating & cooling: Natural gas forced-air heating; Ceiling fan(s) for cooling
- Interior features: Range; Refrigerator; Crawl space basement
- Laundry & utility: Washer/dryer information not provided
Neighborhood map
What this means for you Summary
Snapshot
- This is a 2-bed/1.0-bath manufactured listed at $38k.
Deal economics
- At list price, monthly cash flow is $-32 ($-379/yr) — negative.
- To cash-flow at today's rent, offer at most $33k (12.1% below list).
- Meets the 1% rule at list price ($817 rent vs $38k).
- Recommended offer: $33k (12.1% below list) — sets the bar for cash-flow.
- Cap rate 5.3% vs local median 3.2% in Bellevue — top-decile yield for the area; either an underpriced asset or a hidden risk that comps aren't pricing in. Stress-test before assuming the spread holds.
Location & tenants
- Location reads 77/100 on livability (#181 in OH, #2,807 nationally) — a middle-class / working-renter tenant base. Strengths: cost of living A+, housing A+, health & safety A+; Watch: amenities F, commute F.
- Bellevue City (town): math 56% / reading 65% proficiency, ranked #280 of 656 in OH (top 43%) — acceptable for families but not a draw, mixed tenant base, ~2y average lease.
- Zoned schools: Bellevue Elementary School (math 66% / reading 63%, grade B, #522 of 1,584 statewide, top 36%, 866 students, 44% FRL); Bellevue Middle School (math 53% / reading 64%, grade B, #287 of 654 statewide, top 45%, 416 students, 37% FRL); Bellevue High School (math 32% / reading 72%, grade D+, #343 of 781 statewide, top 47%, 534 students, 33% FRL).
- Market conditions: 44 active listings in the ZIP; 40 units permitted in Huron County in 2024 (0 in 5+ unit buildings).
- This rent is only 15% of the median local income ($64k/yr) — well below the 30% rent-burden line; pricing power to push rent on renewal without tenant pushback.
Forward outlook
- Local home prices are declining (-3.0%/yr); year-one equity from $262 of loan paydown is wiped out by about $1k of value loss. Plan a longer hold.
- Huron County population projected at -22% by 2050 — secular population decline; favor cash flow + early exit over multi-decade hold.
Negotiation context
- It's been on market 34 days — a 3% lower offer ($37k) is reasonable based on typical stale-listing flexibility.
Risks & watch-outs
- Watch-outs: HOA is 51% of rent.
Questions for the listing agent
- What do current leases actually rent for vs. the listed asking? Can we see a recent rent roll and the last 12 months of T-12 income?
- It's been on market 34 days. Have you received any prior offers? Is the seller open to a 12% concession, seller financing, or rate buy-down credit?
- What does the HOA fee cover, when was the last increase, and are there any pending special assessments or reserve-fund shortfalls?
- Is there a deadline driving the sale (1031 exchange, divorce, estate, relocation)? That informs how much negotiation room exists.
- Schools are A-rated — typically a magnet for longer-tenancy family renters. What's the average tenant stay here, and is there a school-zone premium baked into asking?
- The area grade is low — what's the realistic commute time and amenity access for the typical tenant pool here? Any planned neighborhood developments (good or bad) we should know about?
- What's the average days-on-market for RENTAL listings here right now (not sales)? A rising rental-DOM trend means longer vacancies and softer asking-rent achievability than the comps imply.
- What's the recent tenant-quality profile in this submarket — average credit score on applications, eviction rate, late-payment / NSF rate, and stable-employment percentage? A property-management company in the area should have these aggregated.
- How much new for-sale + rental construction is in the pipeline within 1–3 miles? Heavy new supply typically softens prices + rents 12–24 months out; constrained supply supports both.
Investment metrics
- 1% rule
- 2.16% ✓
- Cap rate
- 5.29%
- Cash-on-cash
- -3.57%
- DSCR
- 0.84
- GRM
- 3.9
CMA / ARV
No comps found within radius.
Projected returns pro-forma
-3.0% appreciation · 3.0% rent growth · sell at horizon
- IRR
- -21.3%
- Equity multiple
- 0.26×
- Total profit
- $-7,885
- Equity at exit
- $5,651
- IRR
- -13.0%
- Equity multiple
- 0.21×
- Total profit
- $-8,370
- Equity at exit
- $3,277
Cash invested: $10,612 (down + closing). Projections, not guarantees.
Landlord ↔ Tenant lean methodology
- Overall (STATE)
- 73 Landlord-Friendly
- State Ohio
- 73 Landlord-Friendly · R+6
- County
- — inherits STATE
- City
- — inherits STATE
ZIP-level market 44811
- Home prices YoY
- -28.7%
- Active inventory
- 44
- Price-to-rent
- 3.9×
Monthly cashflow live
- Estimated rent
- $817 medium interval (Pro) →
- Mortgage (P&I)
- −$199
- Tax est. 1.5%
- −$47 /mo · $568/yr
- Insurance
- −$16
- HOA
- −$415
- Vacancy / Maint / Mgmt
- −$172
- Net cashflow
- $-32
Break-even live
Sensitivity live
| Price | -10% $-5 | -5% $-18 | +0% $-32 | +5% $-45 | +10% $-58 |
|---|---|---|---|---|---|
| Rent | -10% $-96 | -5% $-64 | +0% $-32 | +5% $1 | +10% $33 |
| Rate | -1.0pp $-12 | -0.5pp $-22 | base $-32 | +0.5pp $-41 | +1.0pp $-51 |
UW: 25.0% down · 7.5% · 30yr · 1.5% tax · 5.0% vac · 8.0% maint · 8.0% mgmt
Financing live
Cash to close
- Down payment
- $9,475
- Closing costs
- $1,137
- Reserves months
- —
- Total cash needed
- —
Loan-product check · same deal, 3 products live
Conventional
25% down · 7.5% · 30yr
- Down + closing
- —
- Monthly P&I
- —
- Monthly cashflow
- —
- DSCR
- —
- Eligible?
- —
Personal DTI + credit; lowest rate.
DSCR
20% down · 8.5% · 30yr
- Down + closing
- —
- Monthly P&I
- —
- Monthly cashflow
- —
- DSCR
- —
- Eligible?
- —
No personal income docs; deal must DSCR.
Hard money
10% down · 12.0% · 12mo
- Down + closing
- —
- Monthly P&I
- —
- Monthly cashflow
- —
- DSCR
- —
- Eligible?
- —
Short-term bridge; refi at stabilization.
HOA detail
- Monthly dues
- $415 · $4,980/yr
- Likely covers
- watersecurity
Listing history 18 events
-
2026-06-21days on market $37,900 Active 34 DOM
-
2026-06-21days on market $37,900 Active 33 DOM
-
2026-06-18days on market $37,900 Active 31 DOM
-
2026-06-17days on market $37,900 Active 30 DOM
-
2026-06-16days on market $37,900 Active 29 DOM
-
2026-06-15days on market $37,900 Active 28 DOM
-
2026-06-13days on market $37,900 Active 26 DOM
-
2026-06-12days on market $37,900 Active 25 DOM
-
2026-06-09days on market $37,900 Active 22 DOM
-
2026-06-08days on market $37,900 Active 21 DOM
-
2026-06-07days on market $37,900 Active 20 DOM
-
2026-06-07days on market $37,900 Active 19 DOM
-
2026-06-04days on market $37,900 Active 16 DOM
-
2026-06-02days on market $37,900 Active 15 DOM
-
2026-06-01days on market $37,900 Active 14 DOM
-
2026-05-31days on market $37,900 Active 13 DOM
-
2026-05-22price $37,900
-
2026-05-15$35,000 Active
ⓘ Source: listings_history table (triggers on properties + properties_extension) + one-shot
backfill from property_details.listing_events for pre-trigger history.
Climate risk First Street
- Flood 1/10 Low FEMA zone X (unshaded) · 0% chance over 30 yrs
- Wildfire 1/10 Low
- Heat 3/10 Moderate 7 d/yr ≥98°F today · 17 d/yr by 30 yrs out
- Wind 1/10 Low
- Air quality 3/10 Moderate 2 unhealthy d/yr today · 4 by 30 yrs out
Nearby sold comps map
Loading sold comps map…
Walkable amenities ~0.75 mi
Loading nearby amenities…
Taxation est. · year 1
- Rental income
- $9,803
- − Mortgage interest
- −$2,123
- − Property taxes
- −$568
- − Insurance
- −$190
- − Repairs & maintenance
- −$784
- − Management
- −$784
- − HOA
- −$4,980
- − Depreciation
- −$1,103
- Taxable loss
- −$729
- Est. tax savings @ 24.0%
- +$175
- After-tax cash flow
- $-204/yr
For passive investors: Depreciation is non-cash, so a rental often shows a tax loss while cash-flowing — sheltering income. Rental losses are passive: they offset passive income freely, and up to $25,000/yr can offset ordinary (W-2) income if you actively participate and your MAGI is under $100k (phasing out to $0 by $150k); unused losses carry forward. On sale, claimed depreciation is recaptured at up to 25%, and gains may owe capital-gains tax (a 1031 exchange can defer both). Figures are a year-1 estimate at your 24.0% rate — not tax advice; consult a CPA.
Schools (NCES district)
- District
- Bellevue City
- NCES district ID
- 3904359
- Math proficiency
- 56% ▼ -18.00%
- Reading proficiency
- 65% ▼ -10.00%
- Median HH income
- $52,591
- Composite
- 51.71/100
- National rank
- #1687
- State rank
- #280 of 656 in OH
Livability — Bellevue
- Score
- 77/100
- State rank
- #181
- US rank
- #2807
Category grades
Schools grade is shown separately in the Schools card above.
Census & demographics
- Census place
- Bellevue, OH
- County
- Seneca · 70,739 people
- Population (ZIP)
- 12,486
- Household income
- $64,453
- Rent vs Own
- Severe rent burden
- 1.6
Population outlook (Huron County) Hauer SSP2
- Today (2025)
- 55,572 people
- By 2030
- 53,514 · -3.7%
- By 2040
- 48,770 · -12.2%
- By 2050
- 43,611 · -21.5%
- By 2075
- 32,349 · -41.8%
- By 2100
- 21,849 · -60.7%
Race, ethnicity, and origin ACS 2023
- Neighborhood character
- Predominantly White (91%)
- Race & ethnicity
- White 91% Hispanic / Latino 6% Two or more races 5%
- Hispanic origin (detail)
- Mexican 4%
- Common ancestry
- Romanian 4% Italian 2% Lithuanian 2%
- Foreign-born
- 3% · Canada, China
- Languages at home
- 95% English-only · Spanish 2% Other Indo-European 0%
Political lean MEDSL · Huron
- 2024 margin
- Solid R (+44.0) · D 27.6% · R 71.6%
- 2008→2024 swing
- -40.9pp toward R · 2008: -3.1pp · 2024: -44.0pp
- All cycles
- 2024: R+44.0 2020: R+41.2 2016: R+36.4 2012: R+8.9 2008: R+3.1
Not yet ingested
- Civics
- —
Market trends
- HPI YoY
- ▼ -83.28%
- Current HPI
- 206.4977
- Rent YoY
- —
- Metro
- —
- State GDP YoY
- ▲ 1.98%
- F500 in state
- 48
Industry mix (Fortune 500 HQ in OH)
| Industry | F500 HQs | Revenue |
|---|---|---|
| Insurance | 3 | $145B |
|
||
| Industrial Machinery | 3 | $49B |
|
||
| Financial Services | 3 | $24B |
|
||
| Consumer Goods | 2 | $93B |
|
||
| Aerospace / Defense | 2 | $47B |
|
||
| Utilities | 2 | $33B |
|
||
Price history
+8.3% since first listed2 events — show timeline
- 2026-05-22 Price Changed $37,900 FAOR
- 2026-05-15 Listed $35,000 FAOR
Cash-flow waterfall
monthlySold comps — $/sqft
last 12 mo · ≤1 miLoading sold comps…