120 Lcr 632
Groesbeck, TX 76642
$140,000D-
3 bd · 2.0 ba ·
1,216 sqft ·
Built 2011
· SingleFamily
· Active
· 45 DOM
Cashflow @ list (25.0% down · 7.5%)
Estimated rent
$1,206/mo
Mortgage (P&I)
−$734
Tax + insurance
−$233
HOA
−$0
Vac / Maint / Mgmt
−$253
Net cashflow
$-15/mo
Annual
$-180/yr
Cap rate
6.16%
Cash-on-cash
-0.46%
DSCR
0.98
1% rule
0.86%
Cash to close
$39,200
Investor read
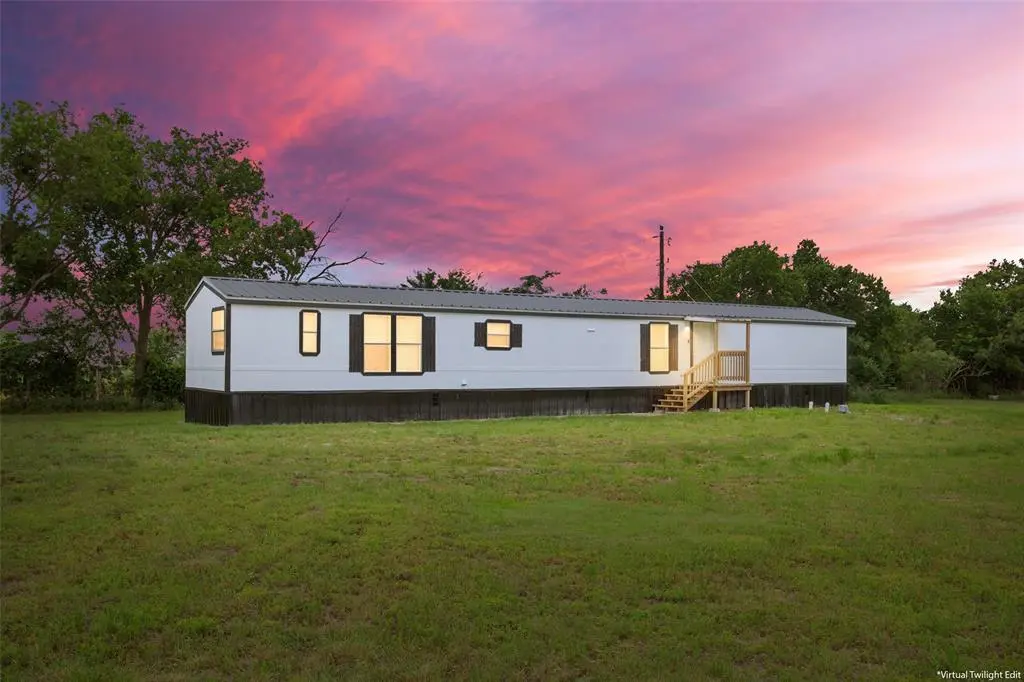
- This is a 3-bed/2.0-bath single-family listed at $140k. Condition is rated good.
- At list price, monthly cash flow is $-15 ($-180/yr) — negative.
- To cash-flow at today's rent, offer at most $138k (1.6% below list).
- To meet the 1% rule (rent ≥ 1% of price), the offer needs to be $121k (13.9% below list).
- It's been on market 45 days — a 3% lower offer ($136k) is reasonable based on typical stale-listing flexibility.
- Recommended offer: $121k (13.9% below list) — sets the bar for 1% rule.
- Local home prices are declining (-3.0%/yr); year-one equity from $968 of loan paydown is wiped out by about $4k of value loss. Plan a longer hold.
- Location reads 64/100 on livability (#777 in TX) — a middle-class / working-renter tenant base. Strengths: cost of living A+, housing A+; Watch: schools F, amenities F, commute F.
- Groesbeck ISD (rural): math 28% / reading 31% proficiency, ranked #634 of 826 in TX (top 77%) — low school quality limits family demand, transient renter base, plan for 1-2y turnover.
- Market conditions: 122 active listings in the ZIP; 17 units permitted in Limestone County in 2024 (0 in 5+ unit buildings).
- Limestone County population projected to shrink 4% by 2050 — rents likely to lag national; underwrite the cash flow, not the appreciation.
- 2 sale attempts with the ask held roughly flat each time — persistent listings suggest the price (not the market) is what's stuck; bring a comps-based counter.
- Cap rate 6.2% vs local median 1.5% in Groesbeck — top-decile yield for the area; either an underpriced asset or a hidden risk that comps aren't pricing in. Stress-test before assuming the spread holds.
Questions for listing agent
- What do current leases actually rent for vs. the listed asking? Can we see a recent rent roll and the last 12 months of T-12 income?
- It's been on market 45 days. Have you received any prior offers? Is the seller open to a 14% concession, seller financing, or rate buy-down credit?
- Is there a deadline driving the sale (1031 exchange, divorce, estate, relocation)? That informs how much negotiation room exists.
- Schools are F-rated, which usually means shorter tenancies and higher turnover. Who's the typical renter profile here, and what's been the actual vacancy rate?
- The area grade is low — what's the realistic commute time and amenity access for the typical tenant pool here? Any planned neighborhood developments (good or bad) we should know about?
- What's the average days-on-market for RENTAL listings here right now (not sales)? A rising rental-DOM trend means longer vacancies and softer asking-rent achievability than the comps imply.
- What's the recent tenant-quality profile in this submarket — average credit score on applications, eviction rate, late-payment / NSF rate, and stable-employment percentage? A property-management company in the area should have these aggregated.
- How much new for-sale + rental construction is in the pipeline within 1–3 miles? Heavy new supply typically softens prices + rents 12–24 months out; constrained supply supports both.
CashFlowRE · CFR-D67NM7F00WPAJB
· Data 3 h ago
cashflowre.app · 2026-05-29