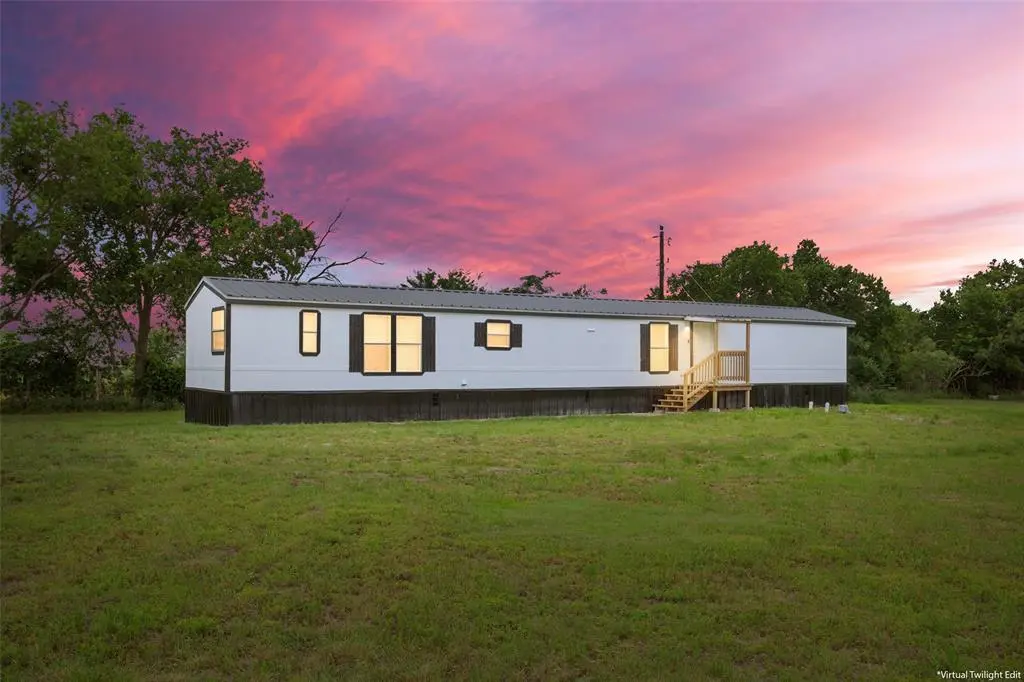
120 Lcr 632 · Groesbeck, TX
Flood risk No data
- FEMA flood zone
- —
- Chance of flooding over 30 yrs
- —
- Est. flood insurance / yr
- —
Fire risk No data
- Est. fire insurance / yr
- —
Heat risk No data
- Hot days now (above threshold)
- —
- Hot days in 30 yrs
- —
Wind risk No data
- Chance of severe wind over 30 yrs
- —
Air-quality risk No data
- Unhealthy air days now
- —
- Unhealthy air days in 30 yrs
- —
Risk factors via First Street. Map © Google.
Why this score? — see what drove the D- grade
The composite is a weighted blend of 9 inputs, each scored 0–100. Each bar is that input's sub-score; the figure is the points it added to the 100-point composite (weight × sub-score).
- Cash flow +12.7/30.0
- ARV discount +7.5/15.0
- Condition / age +4.0/5.0
- DSCR +3.8/10.0
- 1% rule +3.6/10.0
- Livability +3.2/5.0
- Rent growth +2.5/5.0
- Schools +2.5/10.0
- Appreciation +0.0/10.0
$140,000
🖨 Deal sheet 📄 Offer letter ✓ Due diligence
Listing remarks
Freshly remodeled 3-bedroom, 2-bathroom manufactured home on approximately one acre in Limestone County. Final boundaries to be determined by survey. The primary suite includes a double vanity, garden tub, and separate shower. Dedicated laundry room. Stove, refrigerator, and dishwasher convey. Septic and HVAC both under two years old. Corner lot in a peaceful, quiet rural setting. A blank canvas with no known deed restrictions and room to make it yours.
Key facts
- Double vanity
- Remodeled
- Separate shower
Tags
Property features AI
Finance
- Other: Approximately 1 acre lot (seller notes 1.0 acre); Parcel: R133991
- Financial info: Listing accepts Cash, Conventional, USDA and VA financing; Treat as clear loan type; No second mortgage
- HOA & community: No association
Exterior
- Parking: Additional off-street parking
- Utilities: Aerobic septic; Co-op water; Electricity connected; Not in a municipal utility district
- Home design: Single-family residence; Residential property; One story; Preowned (built in 2011); Property is not attached
- Construction: Metal roof; Built in 2011
- Exterior features: Front porch; Cleared vegetation; Will subdivide
Interior
- Kitchen: Eat-in kitchen with breakfast bar, built-in cabinets and pantry; Dishwasher; Electric cooktop; Electric oven; Refrigerator; Electric water heater
- Bedrooms: 3 bedrooms (all on the main level); Primary bedroom on the main level
- Flooring: Luxury vinyl plank
- Bathrooms: 2 full bathrooms; Primary bathroom with dual sinks, garden tub and separate shower (ensuite)
- Heating & cooling: Central heating (electric); Central air; Ceiling fans; Electric heating
- Interior features: Built-in features; Double vanity; Eat-in kitchen; 8 total rooms; One level; One living area; One dining area
- Laundry & utility: Full-size washer/dryer area; Washer hookup; Electric dryer hookup; Utility room with built-in cabinets
Neighborhood map
What this means for you Summary
Snapshot
- This is a 3-bed/2.0-bath single-family listed at $140k. Condition is rated good.
Deal economics
- At list price, monthly cash flow is $-15 ($-180/yr) — negative.
- To cash-flow at today's rent, offer at most $138k (1.6% below list).
- To meet the 1% rule (rent ≥ 1% of price), the offer needs to be $121k (13.9% below list).
- Recommended offer: $121k (13.9% below list) — sets the bar for 1% rule.
- Cap rate 6.2% vs local median 1.6% in Groesbeck — top-decile yield for the area; either an underpriced asset or a hidden risk that comps aren't pricing in. Stress-test before assuming the spread holds.
Location & tenants
- Location reads 64/100 on livability (#777 in TX) — a middle-class / working-renter tenant base. Strengths: cost of living A+, housing A+; Watch: schools F, amenities F, commute F.
- Groesbeck ISD (rural): math 28% / reading 31% proficiency, ranked #634 of 826 in TX (top 77%) — low school quality limits family demand, transient renter base, plan for 1-2y turnover.
- Market conditions: 122 active listings in the ZIP; 17 units permitted in Limestone County in 2024 (0 in 5+ unit buildings).
Forward outlook
- Local home prices are declining (-3.0%/yr); year-one equity from $968 of loan paydown is wiped out by about $4k of value loss. Plan a longer hold.
- Limestone County population projected to shrink 4% by 2050 — rents likely to lag national; underwrite the cash flow, not the appreciation.
Negotiation context
- It's been on market 43 days — a 3% lower offer ($136k) is reasonable based on typical stale-listing flexibility.
- 2 sale attempts with the ask held roughly flat each time — persistent listings suggest the price (not the market) is what's stuck; bring a comps-based counter.
Questions for the listing agent
- What do current leases actually rent for vs. the listed asking? Can we see a recent rent roll and the last 12 months of T-12 income?
- It's been on market 43 days. Have you received any prior offers? Is the seller open to a 14% concession, seller financing, or rate buy-down credit?
- Is there a deadline driving the sale (1031 exchange, divorce, estate, relocation)? That informs how much negotiation room exists.
- Schools are F-rated, which usually means shorter tenancies and higher turnover. Who's the typical renter profile here, and what's been the actual vacancy rate?
- The area grade is low — what's the realistic commute time and amenity access for the typical tenant pool here? Any planned neighborhood developments (good or bad) we should know about?
- What's the average days-on-market for RENTAL listings here right now (not sales)? A rising rental-DOM trend means longer vacancies and softer asking-rent achievability than the comps imply.
- What's the recent tenant-quality profile in this submarket — average credit score on applications, eviction rate, late-payment / NSF rate, and stable-employment percentage? A property-management company in the area should have these aggregated.
- How much new for-sale + rental construction is in the pipeline within 1–3 miles? Heavy new supply typically softens prices + rents 12–24 months out; constrained supply supports both.
Investment metrics
- 1% rule
- 0.86% ✗
- Cap rate
- 6.16%
- Cash-on-cash
- -0.46%
- DSCR
- 0.98
- GRM
- 9.7
CMA / ARV
No comps found within radius.
Projected returns pro-forma
-3.0% appreciation · 3.0% rent growth · sell at horizon
- IRR
- -17.0%
- Equity multiple
- 0.40×
- Total profit
- $-23,624
- Equity at exit
- $20,874
- IRR
- -8.9%
- Equity multiple
- 0.45×
- Total profit
- $-21,729
- Equity at exit
- $12,105
Cash invested: $39,200 (down + closing). Projections, not guarantees.
Landlord ↔ Tenant lean methodology
- Overall (STATE)
- 87 Strongly Landlord-Friendly
- State Texas
- 87 Strongly Landlord-Friendly · R+5
- County
- — inherits STATE
- City
- — inherits STATE
ZIP-level market 76642
- Home prices YoY
- -18.0%
- Active inventory
- 122
- Price-to-rent
- 9.7×
Monthly cashflow live
- Estimated rent
- $1,206 medium interval (Pro) →
- Mortgage (P&I)
- −$734
- Tax est. 1.5%
- −$175 /mo · $2,100/yr
- Insurance
- −$58
- HOA
- −$0
- Vacancy / Maint / Mgmt
- −$253
- Net cashflow
- $-15
Break-even live
UW: 25.0% down · 7.5% · 30yr · 1.5% tax · 5.0% vac · 8.0% maint · 8.0% mgmt
Financing live
Cash to close
- Down payment
- $35,000
- Closing costs
- $4,200
- Reserves months
- —
- Total cash needed
- —
Loan-product check · same deal, 3 products live
Conventional
25% down · 7.5% · 30yr
- Down + closing
- —
- Monthly P&I
- —
- Monthly cashflow
- —
- DSCR
- —
- Eligible?
- —
Personal DTI + credit; lowest rate.
DSCR
20% down · 8.5% · 30yr
- Down + closing
- —
- Monthly P&I
- —
- Monthly cashflow
- —
- DSCR
- —
- Eligible?
- —
No personal income docs; deal must DSCR.
Hard money
10% down · 12.0% · 12mo
- Down + closing
- —
- Monthly P&I
- —
- Monthly cashflow
- —
- DSCR
- —
- Eligible?
- —
Short-term bridge; refi at stabilization.
Listing history 17 events
-
2026-06-18days on market $140,000 Active 43 DOM
-
2026-06-17days on market $140,000 Active 42 DOM
-
2026-06-16days on market $140,000 Active 41 DOM
-
2026-06-15days on market $140,000 Active 40 DOM
-
2026-06-13days on market $140,000 Active 38 DOM
-
2026-06-12days on market $140,000 Active 37 DOM
-
2026-06-09days on market $140,000 Active 34 DOM
-
2026-06-08days on market $140,000 Active 33 DOM
-
2026-06-08days on market $140,000 Active 32 DOM
-
2026-06-07days on market $140,000 Active 31 DOM
-
2026-06-03days on market $140,000 Active 28 DOM
-
2026-06-02days on market $140,000 Active 27 DOM
-
2026-06-01days on market $140,000 Active 26 DOM
-
2026-05-31days on market $140,000 Active 25 DOM
-
2026-05-06$140,000 Active 463-char remark
-
2025-02-09historical $1,250
-
2025-01-18$1,250
ⓘ Source: listings_history table (triggers on properties + properties_extension) + one-shot
backfill from property_details.listing_events for pre-trigger history.
Nearby sold comps map
Loading sold comps map…
Walkable amenities ~0.75 mi
Loading nearby amenities…
Taxation est. · year 1
- Rental income
- $14,468
- − Mortgage interest
- −$7,842
- − Property taxes
- −$2,100
- − Insurance
- −$700
- − Repairs & maintenance
- −$1,157
- − Management
- −$1,157
- − Depreciation
- −$4,073
- Taxable loss
- −$2,562
- Est. tax savings @ 24.0%
- +$615
- After-tax cash flow
- $435/yr
For passive investors: Depreciation is non-cash, so a rental often shows a tax loss while cash-flowing — sheltering income. Rental losses are passive: they offset passive income freely, and up to $25,000/yr can offset ordinary (W-2) income if you actively participate and your MAGI is under $100k (phasing out to $0 by $150k); unused losses carry forward. On sale, claimed depreciation is recaptured at up to 25%, and gains may owe capital-gains tax (a 1031 exchange can defer both). Figures are a year-1 estimate at your 24.0% rate — not tax advice; consult a CPA.
Condition & rehab AI · 12 photos
This freshly remodeled 3-bedroom, 2-bathroom manufactured home is in good condition with no major repairs needed. It offers a peaceful rural setting and is ready for immediate occupancy.
Value-add opportunities
- Resale Paint exterior shutters — Fresh paint enhances curb appeal and adds value.
- Rental Clean gutters — Clean gutters improve drainage and reduce maintenance costs for tenants.
Renovation cost estimate screening
Value-add ROI direction
- Resale Paint exterior shutters — Fresh paint enhances curb appeal and adds value. ↑
- Rental Clean gutters — Clean gutters improve drainage and reduce maintenance costs for tenants. ↑
ⓘ Cost ranges are severity-bucket heuristics (US national rule-of-thumb). Get contractor quotes + a written scope before underwriting a rehab budget.
Schools (NCES district)
- District
- Groesbeck ISD
- NCES district ID
- 4821810
- Math proficiency
- 28% ▼ -10.00%
- Reading proficiency
- 31% ▼ -9.00%
- Median HH income
- $44,929
- Composite
- 25.3/100
- National rank
- #7487
- State rank
- #634 of 826 in TX
Livability — Groesbeck
- Score
- 64/100
- State rank
- #777
- US rank
- #14137
Category grades
Schools grade is shown separately in the Schools card above.
Census & demographics
- Population (ZIP)
- 6,226
Population outlook (Limestone County) Hauer SSP2
- Today (2025)
- 23,396 people
- By 2030
- 23,214 · -0.8%
- By 2040
- 22,829 · -2.4%
- By 2050
- 22,516 · -3.8%
- By 2075
- 22,088 · -5.6%
- By 2100
- 20,354 · -13.0%
Race, ethnicity, and origin ACS 2023
- Neighborhood character
- Diverse neighborhood (Simpson 0.58)
- Race & ethnicity
- White 59% Black 22% Hispanic / Latino 16% Two or more races 13% Asian 1%
- Hispanic origin (detail)
- Mexican 14%
- Common ancestry
- Lithuanian 4% Slovak 2% Iranian 1%
- Foreign-born
- 7% · Canada, Vietnam
- Languages at home
- 88% English-only · Spanish 10% Vietnamese 1%
Political lean MEDSL · Limestone
- 2024 margin
- Solid R (+56.9) · D 21.2% · R 78.1%
- 2008→2024 swing
- -23.4pp toward R · 2008: -33.5pp · 2024: -56.9pp
- All cycles
- 2024: R+56.9 2020: R+50.3 2016: R+52.3 2012: R+40.7 2008: R+33.5
Not yet ingested
- Civics
- —
Market trends
- HPI YoY
- ▼ -41.70%
- Current HPI
- 190.097
- Rent YoY
- —
- Metro
- —
- State GDP YoY
- ▲ 3.95%
- F500 in state
- 110
Industry mix (Fortune 500 HQ in TX)
| Industry | F500 HQs | Revenue |
|---|---|---|
| Energy | 16 | $1,198B |
|
||
| Technology | 5 | $198B |
|
||
| Engineering / Construction | 4 | $72B |
|
||
| Energy Services | 3 | $60B |
|
||
| Utilities | 3 | $41B |
|
||
| Healthcare | 2 | $330B |
|
||
Price history
+11100.0% since first listed3 events — show timeline
- 2026-05-06 Listed $140,000 NTREIS
- 2025-02-09 Rental Removed $1,250 APPFOLIO
- 2025-01-18 Listed for Rent $1,250 APPFOLIO
Cash-flow waterfall
monthlySold comps — $/sqft
last 12 mo · ≤1 miLoading sold comps…