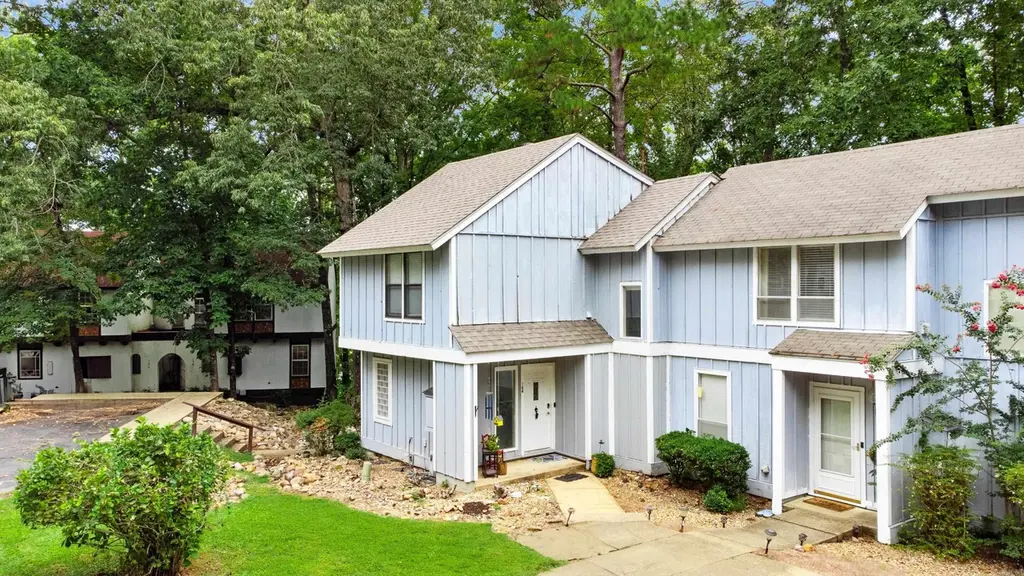
144 La Vista Ln
Hot Springs Village, AR 71909
$135,000C
3 bd · 1.5 ba ·
1,350 sqft ·
Built 1971
· Townhouse
· Active
· 34 DOM
Cashflow @ list (25.0% down · 7.5%)
Estimated rent
$1,551/mo
Mortgage (P&I)
−$708
Tax + insurance
−$121
HOA
−$87
Vac / Maint / Mgmt
−$326
Net cashflow
$310/mo
Annual
$3,715/yr
Cap rate
9.05%
Cash-on-cash
9.83%
DSCR
1.44
1% rule
1.15%
Cash to close
$37,800
Investor read
- This is a 3-bed/1.5-bath townhouse listed at $135k.
- At list price, monthly cash flow is $310 ($4k/yr) — positive.
- The deal already cash-flows at list — no discount required.
- Meets the 1% rule at list price ($2k rent vs $135k).
- It's been on market 34 days — a 3% lower offer ($131k) is reasonable based on typical stale-listing flexibility.
- Recommended offer: $131k (3.0% below list) — sets the bar for market timing.
- Local home prices are declining (-3.0%/yr); year-one equity from $933 of loan paydown is wiped out by about $4k of value loss. Plan a longer hold.
- Location reads 69/100 on livability (#76 in AR) — a middle-class / working-renter tenant base. Strengths: crime A+, housing A+, cost of living A; Watch: schools D+, amenities F, commute F.
- Jessieville School District (rural): math 40% / reading 43% proficiency, ranked #60 of 238 in AR (top 25%) — families likely to look elsewhere, expect single-tenant / working-renter base with shorter leases; 70% free/reduced lunch — lower-income household profile, screen leases tightly.
- Market conditions: 766 active listings in the ZIP; 7 comparable units currently listed for rent nearby; rentals at typical pace (median 24d on market — plan ~3-4 weeks tenant-placement turnaround); solid renter incomes; 117 units permitted in Garland County in 2024 (24 in 5+ unit buildings).
- Garland County population projected at +7% by 2050 — modest demand growth; plan on rents tracking national, not racing it.
- 16 sale attempts since 3y ago with the ask held roughly flat each time — persistent listings suggest the price (not the market) is what's stuck; bring a comps-based counter.
- Climate carrying-cost: extreme-heat days projected 7→19/yr by 2055 (HVAC capex compounding) — expect insurance premiums to compound above CPI over the hold.
- Cap rate 9.0% vs local median 3.6% in Hot Springs Village — top-decile yield for the area; either an underpriced asset or a hidden risk that comps aren't pricing in. Stress-test before assuming the spread holds.
Questions for listing agent
- It's been on market 34 days. Have you received any prior offers? Is the seller open to a 3% concession, seller financing, or rate buy-down credit?
- Built in 1971 — when were the roof, HVAC, electrical panel, plumbing, and water heater last replaced?
- What does the HOA fee cover, when was the last increase, and are there any pending special assessments or reserve-fund shortfalls?
- Is there a deadline driving the sale (1031 exchange, divorce, estate, relocation)? That informs how much negotiation room exists.
- Schools are D-rated, which usually means shorter tenancies and higher turnover. Who's the typical renter profile here, and what's been the actual vacancy rate?
- What's the average days-on-market for RENTAL listings here right now (not sales)? A rising rental-DOM trend means longer vacancies and softer asking-rent achievability than the comps imply.
- What's the recent tenant-quality profile in this submarket — average credit score on applications, eviction rate, late-payment / NSF rate, and stable-employment percentage? A property-management company in the area should have these aggregated.
- How much new for-sale + rental construction is in the pipeline within 1–3 miles? Heavy new supply typically softens prices + rents 12–24 months out; constrained supply supports both.
CashFlowRE · CFR-D6V19CE951T5GV
· Data 2 days ago
cashflowre.app · 2026-05-29