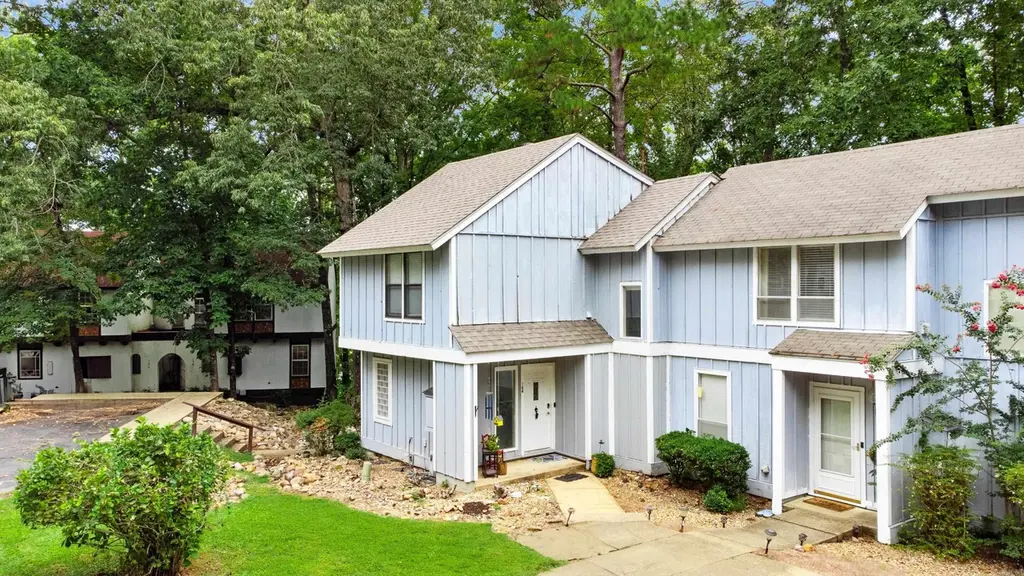
144 La Vista Ln · Hot Springs Village, AR
Flood risk 1/10 · Minimal
- FEMA flood zone
- X (unshaded)
- Chance of flooding over 30 yrs
- 0.0%
- Est. flood insurance / yr
- $507 – $1,088
Fire risk 4/10 · Minor
- Est. fire insurance / yr
- $1,499 – $2,785
Heat risk 5/10 · Moderate
- Hot days now (above 111°F)
- 7 days/yr
- Hot days in 30 yrs
- 19 days/yr
Wind risk 3/10 · Minor
- Chance of severe wind over 30 yrs
- 7.0%
Air-quality risk 1/10 · Minimal
- Unhealthy air days now
- 0 days/yr
- Unhealthy air days in 30 yrs
- 0 days/yr
Risk factors via First Street. Map © Google.
Why this score? — see what drove the C grade
The composite is a weighted blend of 9 inputs, each scored 0–100. Each bar is that input's sub-score; the figure is the points it added to the 100-point composite (weight × sub-score).
- Cash flow +25.4/30.0
- DSCR +8.4/10.0
- 1% rule +6.5/10.0
- ARV discount +4.0/15.0
- Schools +3.5/10.0
- Livability +3.5/5.0
- Rent growth +2.5/5.0
- Condition / age +2.5/5.0
- Appreciation +0.0/10.0
$135,000
🖨 Deal sheet 📄 Offer letter ✓ Due diligence
Listing remarks
Welcome to this beautifully updated 3-bedroom, 2-bath townhome in the heart of Hot Springs Village! Perfectly situated next to the Desoto Golf Course and just moments from Lake Desoto, this location offers the ideal blend of relaxation and convenience. Inside, you’ll love the spacious layout filled with natural light, durable LVP flooring throughout, a stylish updated kitchen, and plenty of storage space. Whether you’re looking for a full-time residence, weekend getaway, or investment opportunity, this low-maintenance home checks all the boxes. Plus, this is your chance to secure an incredible deal with this property being offered as a short sale. Opportunities like this don&rsq
Key facts
- Lake desoto
- Durable lvp flooring
- Updated townhome
Tags
Property features AI
Finance
- Other: Property size listed as approximately 1,350 (source: tax records)
- HOA & community: HOA fee collected monthly ($87); Community amenities include swimming pools, tennis courts, playground, clubhouse and picnic area; Mandatory HOA fee
Exterior
- Parking: Parking pad; 1-car parking
- Security: Gated entrance
- Utilities: Property owners association provides water; Community sewer
- Home design: Single-family property; Entry level details not provided; Facing direction not provided
- Construction: Wood construction; Crawl space foundation
- Exterior features: Wood exterior; Composition roof; Paved road access; Level lot
Interior
- Kitchen: Microwave; Electric range; Dishwasher; Refrigerator stays
- Flooring: Carpet; Tile; Laminate
- Bathrooms: 2 full bathrooms
- Heating & cooling: Central electric cooling; Central electric heat; Heat pump
- Interior features: Carpet, tile, and laminate flooring; Den/Family room
Neighborhood map
What this means for you Summary
Snapshot
- This is a 3-bed/1.5-bath townhouse listed at $135k.
Deal economics
- At list price, monthly cash flow is $310 ($4k/yr) — positive.
- The deal already cash-flows at list — no discount required.
- Meets the 1% rule at list price ($2k rent vs $135k).
- Recommended offer: $131k (3.0% below list) — sets the bar for market timing.
- Cap rate 9.0% vs local median 3.6% in Hot Springs Village — top-decile yield for the area; either an underpriced asset or a hidden risk that comps aren't pricing in. Stress-test before assuming the spread holds.
Location & tenants
- Location reads 69/100 on livability (#76 in AR) — a middle-class / working-renter tenant base. Strengths: crime A+, housing A+, cost of living A; Watch: schools D+, amenities F, commute F.
- Jessieville School District (rural): math 40% / reading 43% proficiency, ranked #60 of 238 in AR (top 25%) — families likely to look elsewhere, expect single-tenant / working-renter base with shorter leases; 70% free/reduced lunch — lower-income household profile, screen leases tightly.
- Market conditions: 766 active listings in the ZIP; 7 comparable units currently listed for rent nearby; rentals at typical pace (median 23d on market — plan ~3-4 weeks tenant-placement turnaround); solid renter incomes; 117 units permitted in Garland County in 2024 (24 in 5+ unit buildings).
Forward outlook
- Local home prices are declining (-3.0%/yr); year-one equity from $933 of loan paydown is wiped out by about $4k of value loss. Plan a longer hold.
- Garland County population projected at +7% by 2050 — modest demand growth; plan on rents tracking national, not racing it.
Negotiation context
- It's been on market 34 days — a 3% lower offer ($131k) is reasonable based on typical stale-listing flexibility.
- 16 sale attempts since 3y ago with the ask held roughly flat each time — persistent listings suggest the price (not the market) is what's stuck; bring a comps-based counter.
Risks & watch-outs
- Climate carrying-cost: extreme-heat days projected 7→19/yr by 2055 (HVAC capex compounding) — expect insurance premiums to compound above CPI over the hold.
Questions for the listing agent
- It's been on market 34 days. Have you received any prior offers? Is the seller open to a 3% concession, seller financing, or rate buy-down credit?
- Built in 1971 — when were the roof, HVAC, electrical panel, plumbing, and water heater last replaced?
- What does the HOA fee cover, when was the last increase, and are there any pending special assessments or reserve-fund shortfalls?
- Is there a deadline driving the sale (1031 exchange, divorce, estate, relocation)? That informs how much negotiation room exists.
- Schools are D-rated, which usually means shorter tenancies and higher turnover. Who's the typical renter profile here, and what's been the actual vacancy rate?
- What's the average days-on-market for RENTAL listings here right now (not sales)? A rising rental-DOM trend means longer vacancies and softer asking-rent achievability than the comps imply.
- What's the recent tenant-quality profile in this submarket — average credit score on applications, eviction rate, late-payment / NSF rate, and stable-employment percentage? A property-management company in the area should have these aggregated.
- How much new for-sale + rental construction is in the pipeline within 1–3 miles? Heavy new supply typically softens prices + rents 12–24 months out; constrained supply supports both.
Investment metrics
- 1% rule
- 1.15% ✓
- Cap rate
- 9.05%
- Cash-on-cash
- 9.83%
- DSCR
- 1.44
- GRM
- 7.3
CMA / ARV
- ARV (median comp)
- $125,203
- List price
- $135,000
- Delta
- 7.82%
- Verdict
- FAIR
- Comps
- 20 within 1.0 mi
Show comp detail 12 sales within ~0.75 mi
| Address | Dist | Beds/Ba | Sqft | Sold | Price | $/sf | Match |
|---|---|---|---|---|---|---|---|
| 168 Cordero Ln | 0.10mi | 3/2.5 | 1,350 (0%) | 2mo | $181,500 | $134 | 90 |
| 190 Cordero Ln | 0.08mi | 3/1.5 | 1,270 (-6%) | 5mo | $168,000 | $132 | 82 |
| 189 Cordero Ln | 0.08mi | 3/2.5 | 1,270 (-6%) | 1mo | $165,000 | $130 | 82 |
| 11 Vaqueria Ln | 0.27mi | 3/2.0 | 1,336 (-1%) | 3mo | $110,000 | $82 | 81 |
| 13 Destino Way | 0.31mi | 3/2.0 | 1,296 (-4%) | 4mo | $63,000 | $49 | 74 |
| 33 Vaqueria Ln | 0.17mi | 3/2.0 | 1,240 (-8%) | 6mo | $120,000 | $97 | 72 |
| 25 Tomisa Ln | 0.49mi | 3/2.0 | 1,440 (+7%) | 0mo | $163,500 | $114 | 63 |
| 53 Perralena Way | 0.41mi | 3/1.5 | 1,160 (-14%) | 2mo | $120,000 | $103 | 56 |
| 2 Tomisa Ln | 0.57mi | 2/1.5 (-1) | 1,260 (-7%) | 3mo | $60,000 | $48 | 55 |
| 35 Destino Way | 0.36mi | 3/2.0 | 1,504 (+11%) | 9mo | $116,500 | $77 | 55 |
| 5 Gailosa Ln | 0.52mi | 2/1.5 (-1) | 1,260 (-7%) | 9mo | $155,000 | $123 | 52 |
| 22 Reddina Ln | 0.57mi | 3/2.0 | 1,476 (+9%) | 10mo | $192,000 | $130 | 47 |
Match score weights: distance 35% · size 25% · config 20% · recency 20%. Top-matched comps best support the ARV.
Projected returns pro-forma
-3.0% appreciation · 3.0% rent growth · sell at horizon
- IRR
- -1.5%
- Equity multiple
- 0.94×
- Total profit
- $-2,144
- Equity at exit
- $20,129
- IRR
- 8.2%
- Equity multiple
- 1.62×
- Total profit
- $23,576
- Equity at exit
- $11,672
Cash invested: $37,800 (down + closing). Projections, not guarantees.
Landlord ↔ Tenant lean methodology
- Overall (STATE)
- 92 Strongly Landlord-Friendly
- State Arkansas
- 92 Strongly Landlord-Friendly · R+14
- County
- — inherits STATE
- City
- — inherits STATE
ZIP-level market 71909
- Home prices YoY
- -10.9%
- Active inventory
- 766
- Price-to-rent
- 7.3×
Monthly cashflow live
- Estimated rent
- $1,551 high interval (Pro) →
- Mortgage (P&I)
- −$708
- Tax from tax record
- −$64 /mo · $773/yr
- Insurance
- −$56
- HOA
- −$87
- Vacancy / Maint / Mgmt
- −$326
- Net cashflow
- $310
Break-even live
UW: 25.0% down · 7.5% · 30yr · 1.5% tax · 5.0% vac · 8.0% maint · 8.0% mgmt
Financing live
Cash to close
- Down payment
- $33,750
- Closing costs
- $4,050
- Reserves months
- —
- Total cash needed
- —
Loan-product check · same deal, 3 products live
Conventional
25% down · 7.5% · 30yr
- Down + closing
- —
- Monthly P&I
- —
- Monthly cashflow
- —
- DSCR
- —
- Eligible?
- —
Personal DTI + credit; lowest rate.
DSCR
20% down · 8.5% · 30yr
- Down + closing
- —
- Monthly P&I
- —
- Monthly cashflow
- —
- DSCR
- —
- Eligible?
- —
No personal income docs; deal must DSCR.
Hard money
10% down · 12.0% · 12mo
- Down + closing
- —
- Monthly P&I
- —
- Monthly cashflow
- —
- DSCR
- —
- Eligible?
- —
Short-term bridge; refi at stabilization.
Rent comps 7 comps
| Address | Beds | Baths | Sqft | Rent | $/sqft | DOM | Units | Dist |
|---|---|---|---|---|---|---|---|---|
| 143 La Vista Ln Hot Springs Village, AR | 2.0 | 1.5 | 1028 | $1,450 | $1.41 | 23d | 1 | 0.01mi |
| 120 Emperado Way Hot Springs Village, AR | 3.0 | 1.5 | 1296 | $1,300 | $1.00 | 23d | 1 | 0.07mi |
| 6 Tomino Way Hot Springs Village, AR | 3.0 | 1.5 | 1549 | $1,350 | $0.87 | 14d | 1 | 0.40mi |
| 2 Dulzura Ln Hot Springs Village, AR | 2.0 | 1.5 | 1120 | $1,200 | $1.07 | 44d | 1 | 0.79mi |
| 16 Dulzura Ln Unit 1 Hot Springs, AR | 2.0 | 1.5 | 1120 | $1,100 | $0.98 | 14d | 1 | 0.81mi |
| 16 Malaga Cir Hot Springs Village, AR | 2.0 | 2.0 | 1694 | $1,850 | $1.09 | 14d | 1 | 1.04mi |
| 4 Astorga Cir Hot Springs Village, AR | 2.0 | 2.0 | 1020 | $1,500 | $1.47 | 23d | 1 | 1.13mi |
HOA detail
- Monthly dues
- $87 · $1,044/yr
Listing history 50 events
-
2026-06-18days on market $135,000 Active 34 DOM
-
2026-06-17days on market $135,000 Active 33 DOM
-
2026-06-16days on market $135,000 Active 32 DOM
-
2026-06-15days on market $135,000 Active 31 DOM
-
2026-06-14days on market $135,000 Active 29 DOM
-
2026-06-10days on market $135,000 Active 26 DOM
-
2026-06-09days on market $135,000 Active 25 DOM
-
2026-06-08days on market $135,000 Active 24 DOM
-
2026-06-07days on market $135,000 Active 23 DOM
-
2026-06-05days on market $135,000 Active 20 DOM
-
2026-06-03days on market $135,000 Active 19 DOM
-
2026-06-02days on market $135,000 Active 18 DOM
-
2026-06-01days on market $135,000 Active 17 DOM
-
2026-05-31days on market $135,000 Active 16 DOM
-
2026-05-31days on market $135,000 Active 15 DOM
-
2026-05-15$135,000 New Listing 779-char remark
-
2026-05-15historical
-
2026-05-02status Active
-
2026-05-02historical
-
2026-04-28status Active
-
2026-04-28historical
-
2026-04-25status Active
-
2026-04-25historical
-
2026-04-20status Active
-
2026-04-20historical
-
2026-03-19$139,900 New Listing
-
2026-03-19historical
-
2026-03-18status Active
-
2026-03-18historical
-
2026-03-17status Active
-
2026-03-17historical
-
2026-03-02status Back on Market
-
2026-02-07historical Take Backups
-
2026-02-07historical
-
2026-02-03historical Take Backups
-
2026-01-31status Active
-
2026-01-31historical
-
2025-11-26$139,900 New Listing
-
2025-11-20historical
-
2025-10-03status Back on Market
-
2025-09-25historical Take Backups
-
2025-09-17$137,000 New Listing
-
2025-09-17historical
-
2025-07-30price $137,000
-
2025-07-21$139,900 New Listing
-
2023-12-18soldstatus $139,900 Sold
-
2023-11-09status Under Contract
-
2023-10-25price $139,900
-
2023-10-16price $149,900
-
2023-10-16status Price Change
ⓘ Source: listings_history table (triggers on properties + properties_extension) + one-shot
backfill from property_details.listing_events for pre-trigger history.
Tax reassessment forecast AR · Resets to sale price
- Current annual tax
- $773 · $64/mo
- Projected year-2 tax
- $864 · $72/mo
- Expected delta
- +$91/yr (+$8/mo · 11.7%)
ⓘ Screening estimate from a state-policy table — verify with the county assessor before closing.
Climate risk First Street
- Flood 1/10 Low FEMA zone X (unshaded) · 0% chance over 30 yrs
- Wildfire 4/10 Moderate
- Heat 5/10 Major 7 d/yr ≥111°F today · 19 d/yr by 30 yrs out
- Wind 3/10 Moderate 7% chance of damaging wind over 30 yrs
- Air quality 1/10 Low 0 unhealthy d/yr today · 0 by 30 yrs out
Nearby sold comps map
Loading sold comps map…
Walkable amenities ~0.75 mi
Loading nearby amenities…
Taxation est. · year 1
- Rental income
- $18,611
- − Mortgage interest
- −$7,562
- − Property taxes
- −$773
- − Insurance
- −$675
- − Repairs & maintenance
- −$1,489
- − Management
- −$1,489
- − HOA
- −$1,044
- − Depreciation
- −$3,927
- Taxable income
- $1,652
- Est. tax owed @ 24.0%
- −$396
- After-tax cash flow
- $3,319/yr
For passive investors: Depreciation is non-cash, so a rental often shows a tax loss while cash-flowing — sheltering income. Rental losses are passive: they offset passive income freely, and up to $25,000/yr can offset ordinary (W-2) income if you actively participate and your MAGI is under $100k (phasing out to $0 by $150k); unused losses carry forward. On sale, claimed depreciation is recaptured at up to 25%, and gains may owe capital-gains tax (a 1031 exchange can defer both). Figures are a year-1 estimate at your 24.0% rate — not tax advice; consult a CPA.
Schools (NCES district)
- District
- Jessieville School District
- NCES district ID
- 0507920
- Math proficiency
- 40% ▼ -6.00%
- Reading proficiency
- 43% ▼ -4.00%
- Median HH income
- $44,066
- Composite
- 35.16/100
- National rank
- #5003
- State rank
- #60 of 238 in AR
Livability — Hot Springs Village
- Score
- 69/100
- State rank
- #76
- US rank
- #8970
Category grades
Schools grade is shown separately in the Schools card above.
Census & demographics
- Census place
- Hot Springs Village, AR
- County
- Saline County · 77,216 people
- City population
- 18,449
- Metro
- Little Rock-North Little Rock-Conway, AR
- Population (ZIP)
- 18,449
- Household income
- $75,433
- Rent vs Own
- Severe rent burden
- 207.0
Population outlook (Garland County) Hauer SSP2
- Today (2025)
- 100,343 people
- By 2030
- 101,880 · +1.5%
- By 2040
- 104,804 · +4.4%
- By 2050
- 107,292 · +6.9%
- By 2075
- 113,182 · +12.8%
- By 2100
- 112,247 · +11.9%
Race, ethnicity, and origin ACS 2023
- Neighborhood character
- Predominantly White (93%)
- Race & ethnicity
- White 93% Two or more races 3% Hispanic / Latino 2%
- Common ancestry
- Slovak 3% Romanian 3% Serbian 2%
- Foreign-born
- 2% · Canada, Vietnam
- Languages at home
- 97% English-only · Spanish 1%
Political lean MEDSL · Garland
- 2024 margin
- Solid R (+36.2) · D 30.8% · R 67.0% · Other 2.2%
- 2008→2024 swing
- -11.3pp toward R · 2008: -25.0pp · 2024: -36.2pp
- All cycles
- 2024: R+36.2 2020: R+34.0 2016: R+34.1 2012: R+29.9 2008: R+25.0
Not yet ingested
- Civics
- —
Market trends
- HPI YoY
- ▼ -24.00%
- Current HPI
- 195.9499
- Rent YoY
- —
- Metro
- Little Rock-North Little Rock-Conway, AR
- State GDP YoY
- ▲ 3.80%
- F500 in state
- 10
Industry mix (Fortune 500 HQ in AR)
| Industry | F500 HQs | Revenue |
|---|---|---|
| Retail | 1 | $681B |
|
||
| Food / Agriculture | 1 | $53B |
|
||
| Retail / Energy | 1 | $22B |
|
||
| Transportation / Logistics | 1 | $12B |
|
||
| Energy | 1 | $4B |
|
||
Price history
+136.8% since first listed39 events — show timeline
- 2026-05-15 Listed $135,000 CARMLS
- 2026-05-15 Listing Removed — CARMLS
- 2026-05-02 Relisted — CARMLS
- 2026-05-02 Listing Removed — CARMLS
- 2026-04-28 Relisted — CARMLS
- 2026-04-28 Listing Removed — CARMLS
- 2026-04-25 Relisted — CARMLS
- 2026-04-25 Listing Removed — CARMLS
- 2026-04-20 Relisted — CARMLS
- 2026-04-20 Listing Removed — CARMLS
- 2026-03-19 Listed $139,900 CARMLS
- 2026-03-19 Listing Removed — CARMLS
- 2026-03-18 Relisted — CARMLS
- 2026-03-18 Listing Removed — CARMLS
- 2026-03-17 Relisted — CARMLS
- 2026-03-17 Listing Removed — CARMLS
- 2026-03-02 Relisted — CARMLS
- 2026-02-07 Contingent — CARMLS
- 2026-02-07 Listing Removed — CARMLS
- 2026-02-03 Contingent — CARMLS
- 2026-01-31 Relisted — CARMLS
- 2026-01-31 Listing Removed — CARMLS
- 2025-11-26 Listed $139,900 CARMLS
- 2025-11-20 Listing Removed — CARMLS
- 2025-10-03 Relisted — CARMLS
- 2025-09-25 Contingent — CARMLS
- 2025-09-17 Listing Removed — CARMLS
- 2025-09-17 Listed $137,000 CARMLS
- 2025-07-30 Price Changed $137,000 CARMLS
- 2025-07-21 Listed $139,900 CARMLS
- 2023-12-18 Sold (MLS) $139,900 CARMLS
- 2023-11-09 Pending — CARMLS
- 2023-10-25 Price Changed $139,900 CARMLS
- 2023-10-16 Price Changed $149,900 CARMLS
- 2023-10-16 Relisted — CARMLS
- 2023-10-06 Listing Removed — CARMLS
- 2023-09-25 Price Changed $157,500 CARMLS
- 2023-09-08 Listed $160,000 CARMLS
- 1998-12-11 Sold (Public Records) $57,000 Public Records
Property tax history
+3.1%/yrLatest (2025): $773 · -1.4% YoY. Source: county tax records.
Cash-flow waterfall
monthlySold comps — $/sqft
last 12 mo · ≤1 miLoading sold comps…