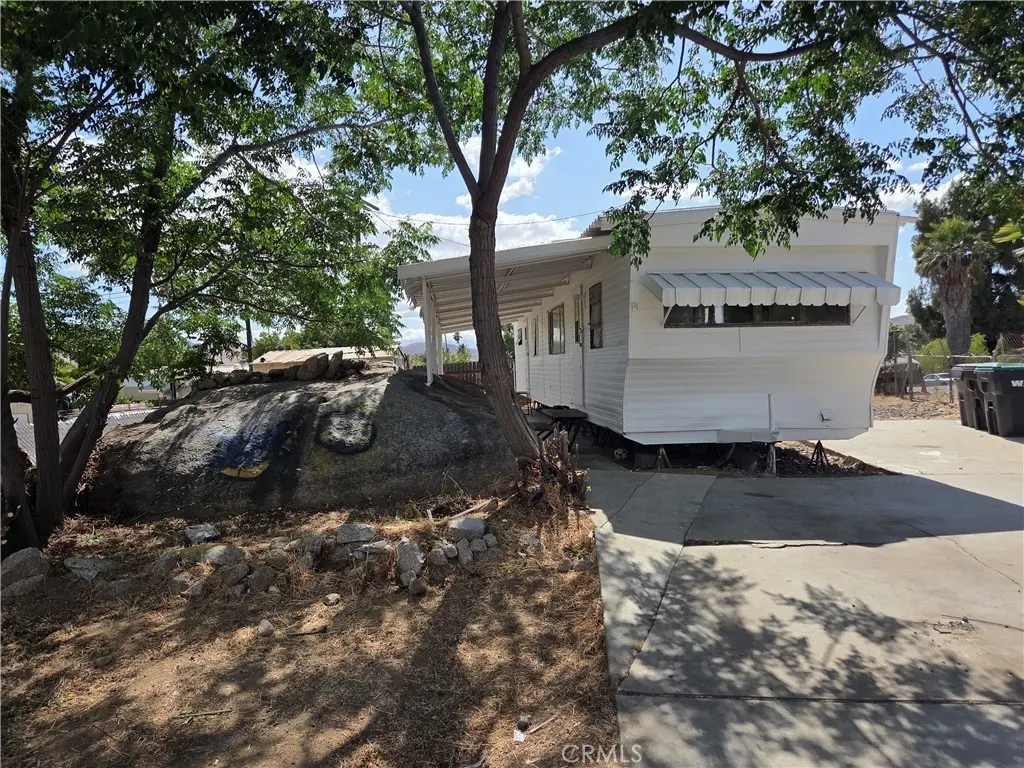
22509 Carter
Good Hope, CA 92570
$199,000C
2 bd · 2.0 ba ·
660 sqft ·
Built 1977
· Manufactured
· Active
· 24 DOM
Cashflow @ list (25.0% down · 7.5%)
Estimated rent
$2,136/mo
Mortgage (P&I)
−$1,044
Tax + insurance
−$120
HOA
−$0
Vac / Maint / Mgmt
−$449
Net cashflow
$525/mo
Annual
$6,296/yr
Cap rate
9.46%
Cash-on-cash
11.30%
DSCR
1.50
1% rule
1.07%
Cash to close
$55,720
Investor read
- This is a 2-bed/2.0-bath manufactured listed at $199k.
- At list price, monthly cash flow is $525 ($6k/yr) — positive.
- The deal already cash-flows at list — no discount required.
- Meets the 1% rule at list price ($2k rent vs $199k).
- It's been on market 24 days — a 2% lower offer ($196k) is reasonable based on typical stale-listing flexibility.
- Recommended offer: $196k (1.5% below list) — sets the bar for market timing.
- Local home prices are declining (-3.0%/yr); year-one equity from $1k of loan paydown is wiped out by about $6k of value loss. Plan a longer hold.
- Location reads 37/100 on livability (#1,418 in CA) — a limited-amenity area; tenant pool skews transient or value-seeking. Strengths: housing A-; Watch: crime F, amenities F, commute F.
- Perris Union High (suburban): math 21% / reading 48% proficiency, ranked #282 of 517 in CA (top 54%) — families likely to look elsewhere, expect single-tenant / working-renter base with shorter leases; 72% free/reduced lunch — lower-income household profile, screen leases tightly.
- Zoned schools: Enchanted Hills Elementary (479 students, 85% FRL); Pinacate Middle (math 11% / reading 27%, grade F, #426 of 498 statewide, top 86%, 927 students, 96% FRL) — zoned schools average 90% FRL vs 72% district-wide (18 pts higher); higher-poverty schools than district average — tighter screening recommended.
- Zoned-school proficiency averages 19% at this address vs 34% district-wide (-16 pts) — the specific schools serving this property underperform the Perris Union High average; the district grade overstates school quality for this exact location.
- Market conditions: 209 active listings in the ZIP; 1 comparable units currently listed for rent nearby; solid renter incomes; 9,195 units permitted in Riverside County in 2024 (1,512 in 5+ unit buildings).
- Riverside County population projected at +22% by 2050 — long-run rental-demand tailwind backs the buy-and-hold thesis.
- At projected returns (-3.0% appreciation + 3.0% rent growth), your $56k cash investment doubles in ~10 years — after that, you're playing with house money.
- Climate carrying-cost: severe wildfire risk; extreme-heat days projected 6→17/yr by 2055 (HVAC capex compounding) — expect insurance premiums to compound above CPI over the hold.
- This rent runs 32% of the median local income ($79k/yr) — at the standard rent-burdened threshold; future hikes will face affordability resistance.
Questions for listing agent
- Built in 1977 — when were the roof, HVAC, electrical panel, plumbing, and water heater last replaced?
- Is there a deadline driving the sale (1031 exchange, divorce, estate, relocation)? That informs how much negotiation room exists.
- Schools are F-rated, which usually means shorter tenancies and higher turnover. Who's the typical renter profile here, and what's been the actual vacancy rate?
- Crime grade is F in this area — have there been break-ins, vandalism, or insurance claims at this property in the last 3 years? What carrier currently insures it and at what premium?
- What's the average days-on-market for RENTAL listings here right now (not sales)? A rising rental-DOM trend means longer vacancies and softer asking-rent achievability than the comps imply.
- What's the recent tenant-quality profile in this submarket — average credit score on applications, eviction rate, late-payment / NSF rate, and stable-employment percentage? A property-management company in the area should have these aggregated.
- How much new for-sale + rental construction is in the pipeline within 1–3 miles? Heavy new supply typically softens prices + rents 12–24 months out; constrained supply supports both.
CashFlowRE · CFR-D8SM6S8NAVKWYX
· Data 23 h ago
cashflowre.app · 2026-05-29