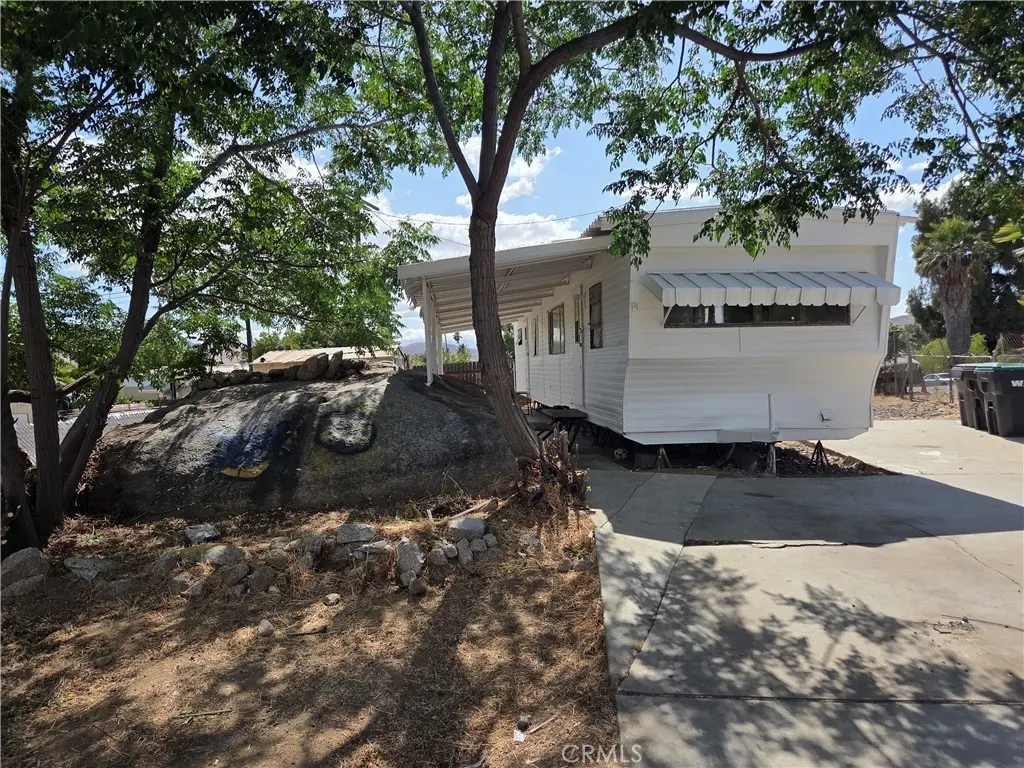
22509 Carter · Good Hope, CA
Flood risk 1/10 · Minimal
- FEMA flood zone
- D
- Chance of flooding over 30 yrs
- 0.0%
- Est. flood insurance / yr
- $544 – $1,084
Fire risk 9/10 · Severe
- Est. fire insurance / yr
- $659 – $1,223
Heat risk 7/10 · Major
- Hot days now (above 103°F)
- 6 days/yr
- Hot days in 30 yrs
- 17 days/yr
Wind risk 1/10 · Minimal
- Chance of severe wind over 30 yrs
- —
Air-quality risk 9/10 · Severe
- Unhealthy air days now
- 19 days/yr
- Unhealthy air days in 30 yrs
- 23 days/yr
Risk factors via First Street. Map © Google.
Why this score? — see what drove the C grade
The composite is a weighted blend of 9 inputs, each scored 0–100. Each bar is that input's sub-score; the figure is the points it added to the 100-point composite (weight × sub-score).
- Cash flow +26.5/30.0
- DSCR +9.0/10.0
- ARV discount +7.5/15.0
- 1% rule +5.7/10.0
- Schools +3.0/10.0
- Rent growth +2.5/5.0
- Condition / age +2.5/5.0
- Livability +1.9/5.0
- Appreciation +0.0/10.0
$199,000
🖨 Deal sheet (PDF) 📄 Offer letter ✓ Due diligence
Listing remarks
* * * cash only * * * Investors bring your tools * * *
Key facts
- 5,663 sq ft lot
- Built 1977
- Listed 23 days
Property features AI
Finance
- Other: Total units: 1
- Financial info: Assessments: Unknown
- HOA & community: Rural community setting
Exterior
- Utilities: Public sewer; District/public water
- Home design: Manufactured house; Single-story
- Construction: Year built per assessor; No ADU; No common walls (detached)
- Exterior features: Corner lot; No pool
Interior
- Bedrooms: 2 main-level bedrooms
- Bathrooms: 2 full bathrooms
- Heating & cooling: Central furnace heating
- Interior features: All bedrooms on the main floor; One-level layout; Entry on the 1st floor
- Laundry & utility: No laundry facilities indicated
Neighborhood map
What this means for you Summary
Snapshot
- This is a 2-bed/2.0-bath manufactured listed at $199k.
Deal economics
- At list price, monthly cash flow is $525 ($6k/yr) — positive.
- The deal already cash-flows at list — no discount required.
- Meets the 1% rule at list price ($2k rent vs $199k).
- Recommended offer: $196k (1.5% below list) — sets the bar for market timing.
Location & tenants
- Location reads 37/100 on livability (#1,418 in CA) — a limited-amenity area; tenant pool skews transient or value-seeking. Strengths: housing A-; Watch: crime F, amenities F, commute F.
- Perris Union High (suburban): math 21% / reading 48% proficiency, ranked #282 of 517 in CA (top 54%) — families likely to look elsewhere, expect single-tenant / working-renter base with shorter leases; 72% free/reduced lunch — lower-income household profile, screen leases tightly.
- Zoned schools: Enchanted Hills Elementary (479 students, 85% FRL); Pinacate Middle (math 11% / reading 27%, grade F, #426 of 498 statewide, top 86%, 927 students, 96% FRL) — zoned schools average 90% FRL vs 72% district-wide (18 pts higher); higher-poverty schools than district average — tighter screening recommended.
- Zoned-school proficiency averages 19% at this address vs 34% district-wide (-16 pts) — the specific schools serving this property underperform the Perris Union High average; the district grade overstates school quality for this exact location.
- Market conditions: 209 active listings in the ZIP; 1 comparable units currently listed for rent nearby; solid renter incomes; 9,195 units permitted in Riverside County in 2024 (1,512 in 5+ unit buildings).
- This rent runs 32% of the median local income ($79k/yr) — at the standard rent-burdened threshold; future hikes will face affordability resistance.
Forward outlook
- Local home prices are declining (-3.0%/yr); year-one equity from $1k of loan paydown is wiped out by about $6k of value loss. Plan a longer hold.
- Riverside County population projected at +22% by 2050 — long-run rental-demand tailwind backs the buy-and-hold thesis.
- At projected returns (-3.0% appreciation + 3.0% rent growth), your $56k cash investment doubles in ~10 years — after that, you're playing with house money.
Negotiation context
- It's been on market 24 days — a 2% lower offer ($196k) is reasonable based on typical stale-listing flexibility.
Risks & watch-outs
- Climate carrying-cost: severe wildfire risk; extreme-heat days projected 6→17/yr by 2055 (HVAC capex compounding) — expect insurance premiums to compound above CPI over the hold.
Questions for the listing agent
- Built in 1977 — when were the roof, HVAC, electrical panel, plumbing, and water heater last replaced?
- Is there a deadline driving the sale (1031 exchange, divorce, estate, relocation)? That informs how much negotiation room exists.
- Schools are F-rated, which usually means shorter tenancies and higher turnover. Who's the typical renter profile here, and what's been the actual vacancy rate?
- Crime grade is F in this area — have there been break-ins, vandalism, or insurance claims at this property in the last 3 years? What carrier currently insures it and at what premium?
- What's the average days-on-market for RENTAL listings here right now (not sales)? A rising rental-DOM trend means longer vacancies and softer asking-rent achievability than the comps imply.
- What's the recent tenant-quality profile in this submarket — average credit score on applications, eviction rate, late-payment / NSF rate, and stable-employment percentage? A property-management company in the area should have these aggregated.
- How much new for-sale + rental construction is in the pipeline within 1–3 miles? Heavy new supply typically softens prices + rents 12–24 months out; constrained supply supports both.
Investment metrics
- 1% rule
- 1.07% ✓
- Cap rate
- 9.46%
- Cash-on-cash
- 11.30%
- DSCR
- 1.50
- GRM
- 7.8
CMA / ARV
No comps found within radius.
Projected returns pro-forma
-3.0% appreciation · 3.0% rent growth · sell at horizon
- IRR
- 0.5%
- Equity multiple
- 1.02×
- Total profit
- $1,069
- Equity at exit
- $29,672
- IRR
- 10.1%
- Equity multiple
- 1.78×
- Total profit
- $43,558
- Equity at exit
- $17,206
Cash invested: $55,720 (down + closing). Projections, not guarantees.
Landlord ↔ Tenant lean methodology
- Overall (STATE)
- 18 Strongly Tenant-Friendly
- State California
- 18 Strongly Tenant-Friendly · D+13
- County
- — inherits STATE
- City
- — inherits STATE
ZIP-level market 92570
- Home prices YoY
- -11.8%
- Active inventory
- 209
- Price-to-rent
- 7.8×
Monthly cashflow live
- Estimated rent
- $2,136 medium interval (Pro) →
- Mortgage (P&I)
- −$1,044
- Tax from tax record
- −$37 /mo · $440/yr
- Insurance
- −$83
- HOA
- −$0
- Vacancy / Maint / Mgmt
- −$449
- Net cashflow
- $525
Break-even live
Sensitivity live
| Price | -10% $637 | -5% $581 | +0% $525 | +5% $468 | +10% $412 |
|---|---|---|---|---|---|
| Rent | -10% $356 | -5% $440 | +0% $525 | +5% $609 | +10% $693 |
| Rate | -1.0pp $625 | -0.5pp $575 | base $525 | +0.5pp $473 | +1.0pp $421 |
UW: 25.0% down · 7.5% · 30yr · 1.5% tax · 5.0% vac · 8.0% maint · 8.0% mgmt
Financing live
Cash to close
- Down payment
- $49,750
- Closing costs
- $5,970
- Reserves months
- —
- Total cash needed
- —
Loan-product check · same deal, 3 products live
Conventional
25% down · 7.5% · 30yr
- Down + closing
- —
- Monthly P&I
- —
- Monthly cashflow
- —
- DSCR
- —
- Eligible?
- —
Personal DTI + credit; lowest rate.
DSCR
20% down · 8.5% · 30yr
- Down + closing
- —
- Monthly P&I
- —
- Monthly cashflow
- —
- DSCR
- —
- Eligible?
- —
No personal income docs; deal must DSCR.
Hard money
10% down · 12.0% · 12mo
- Down + closing
- —
- Monthly P&I
- —
- Monthly cashflow
- —
- DSCR
- —
- Eligible?
- —
Short-term bridge; refi at stabilization.
Rent comps 1 comps
| Address | Beds | Baths | Sqft | Rent | $/sqft | DOM | Units | Dist |
|---|---|---|---|---|---|---|---|---|
| 805 Florablanca Ct Perris, CA | 1.0 | 1.0 | 500 | $1,500 | $3.00 | 0d | 1 | 0.96mi |
Listing history 16 events
-
2026-06-21days on market $199,000 Active 24 DOM
-
2026-06-18days on market $199,000 Active 21 DOM
-
2026-06-17days on market $199,000 Active 20 DOM
-
2026-06-16days on market $199,000 Active 19 DOM
-
2026-06-15days on market $199,000 Active 18 DOM
-
2026-06-13days on market $199,000 Active 16 DOM
-
2026-06-13days on market $199,000 Active 15 DOM
-
2026-06-09days on market $199,000 Active 12 DOM
-
2026-06-08days on market $199,000 Active 11 DOM
-
2026-06-07days on market $199,000 Active 10 DOM
-
2026-06-04days on market $199,000 Active 7 DOM
-
2026-06-03days on market $199,000 Active 6 DOM
-
2026-06-02days on market $199,000 Active 5 DOM
-
2026-06-01days on market $199,000 Active 4 DOM
-
2026-05-31days on market $199,000 Active 3 DOM
-
2026-05-28$199,000 Active
ⓘ Source: listings_history table (triggers on properties + properties_extension) + one-shot
backfill from property_details.listing_events for pre-trigger history.
Tax reassessment forecast CA · Resets to sale price
- Current annual tax
- $440 · $37/mo
- Projected year-2 tax
- $1,512 · $126/mo
- Expected delta
- +$1,072/yr (+$89/mo · 243.4%)
ⓘ Screening estimate from a state-policy table — verify with the county assessor before closing.
Climate risk First Street
- Flood 1/10 Low FEMA zone D · 0% chance over 30 yrs
- Wildfire 9/10 Extreme
- Heat 7/10 Severe 6 d/yr ≥103°F today · 17 d/yr by 30 yrs out
- Wind 1/10 Low
- Air quality 9/10 Extreme 19 unhealthy d/yr today · 23 by 30 yrs out
Nearby sold comps map
Loading sold comps map…
Walkable amenities ~0.75 mi
Loading nearby amenities…
Taxation est. · year 1
- Rental income
- $25,638
- − Mortgage interest
- −$11,147
- − Property taxes
- −$440
- − Insurance
- −$995
- − Repairs & maintenance
- −$2,051
- − Management
- −$2,051
- − Depreciation
- −$5,789
- Taxable income
- $3,164
- Est. tax owed @ 24.0%
- −$759
- After-tax cash flow
- $5,536/yr
For passive investors: Depreciation is non-cash, so a rental often shows a tax loss while cash-flowing — sheltering income. Rental losses are passive: they offset passive income freely, and up to $25,000/yr can offset ordinary (W-2) income if you actively participate and your MAGI is under $100k (phasing out to $0 by $150k); unused losses carry forward. On sale, claimed depreciation is recaptured at up to 25%, and gains may owe capital-gains tax (a 1031 exchange can defer both). Figures are a year-1 estimate at your 24.0% rate — not tax advice; consult a CPA.
Schools (NCES district)
- District
- Perris Union High
- NCES district ID
- 0630210
- Math proficiency
- 21% ▲ 2.00%
- Reading proficiency
- 48% ▲ 5.00%
- Median HH income
- $49,210
- Composite
- 29.75/100
- National rank
- #6439
- State rank
- #282 of 517 in CA
Livability — Good Hope
- Score
- 37/100
- State rank
- #1418
- US rank
- #27561
Category grades
Schools grade is shown separately in the Schools card above.
Census & demographics
- Census place
- Good Hope, CA
- County
- Riverside County · 2,287,001 people
- Metro
- Riverside-San Bernardino-Ontario, CA
- Population (ZIP)
- 58,082
- Household income
- $79,393
- Rent vs Own
- Severe rent burden
- 1140.0
Population outlook (Riverside County) Hauer SSP2
- Today (2025)
- 2,664,475 people
- By 2030
- 2,802,692 · +5.2%
- By 2040
- 3,050,904 · +14.5%
- By 2050
- 3,256,783 · +22.2%
- By 2075
- 3,655,058 · +37.2%
- By 2100
- 3,766,594 · +41.4%
Race, ethnicity, and origin ACS 2023
- Neighborhood character
- Predominantly Hispanic (77%)
- Race & ethnicity
- Hispanic / Latino 77% Two or more races 15% White 14% Black 4% Asian 2% Native American 1%
- Hispanic origin (detail)
- Mexican 68%
- Common ancestry
- Lithuanian 1% Italian 0%
- Foreign-born
- 32% · Canada
- Languages at home
- 33% English-only · Spanish 65% Tagalog/Filipino 1% Other Indo-European 1%
Political lean MEDSL · Riverside
- 2024 margin
- Toss-up / Even · D 48.0% · R 49.3% · Other 2.6%
- 2008→2024 swing
- -3.6pp toward R · 2008: 2.3pp · 2024: -1.3pp
- All cycles
- 2024: R+1.3 2020: D+8.0 2016: D+4.3 2012: R+0.4 2008: D+2.3
Not yet ingested
- Civics
- —
Market trends
- HPI YoY
- ▼ -61.72%
- Current HPI
- 460.1716
- Rent YoY
- —
- Metro
- Riverside-San Bernardino-Ontario, CA
- State GDP YoY
- ▲ 3.21%
- F500 in state
- 116
Industry mix (Fortune 500 HQ in CA)
| Industry | F500 HQs | Revenue |
|---|---|---|
| Technology | 27 | $1,492B |
|
||
| Financial Services | 3 | $174B |
|
||
| Retail | 3 | $44B |
|
||
| Insurance | 3 | $26B |
|
||
| Media / Entertainment | 2 | $115B |
|
||
| Pharmaceuticals / Biotech | 2 | $62B |
|
||
Price history
1 event — show timeline
- 2026-05-28 Listed $199,000 CRMLS
Property tax history
+2.2%/yrLatest (2025): $440 · +2.3% YoY. Source: county tax records.
Cash-flow waterfall
monthlySold comps — $/sqft
last 12 mo · ≤1 miLoading sold comps…