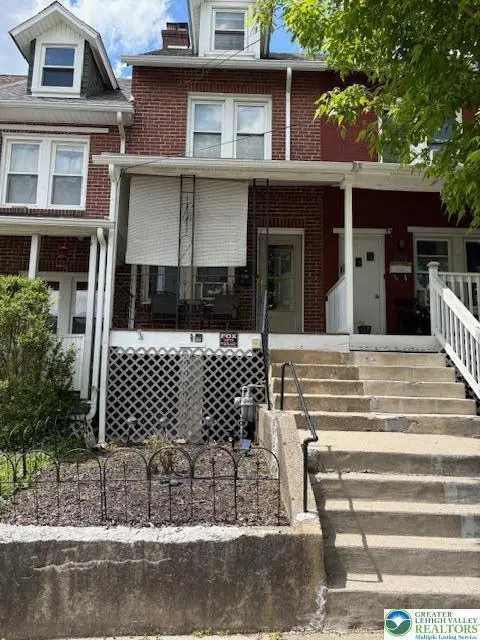
210 Clearfield St
Freemansburg, PA 18017
$175,000B+
4 bd · 1.0 ba ·
878 sqft ·
Built 1900
· SingleFamily
· Pending
· 2 DOM
Cashflow @ list (25.0% down · 7.5%)
Estimated rent
$2,273/mo
Mortgage (P&I)
−$918
Tax + insurance
−$268
HOA
−$0
Vac / Maint / Mgmt
−$477
Net cashflow
$610/mo
Annual
$7,320/yr
Cap rate
10.48%
Cash-on-cash
14.94%
DSCR
1.66
1% rule
1.30%
Cash to close
$49,000
Investor read
- This is a 4-bed/1.0-bath single-family listed at $175k.
- At list price, monthly cash flow is $610 ($7k/yr) — positive.
- The deal already cash-flows at list — no discount required.
- Meets the 1% rule at list price ($2k rent vs $175k).
- Only 2 days on market — expect competitive offers; lowballing is unlikely to land.
- Local home prices are declining (-3.0%/yr); year-one equity from $1k of loan paydown is wiped out by about $5k of value loss. Plan a longer hold.
- Location reads 79/100 on livability (#244 in PA, #2,082 nationally) — a middle-class / working-renter tenant base. Strengths: crime A+, housing A+, health & safety A+; Watch: amenities D, commute F.
- Bethlehem Area SD (urban): math 31% / reading 49% proficiency, ranked #342 of 539 in PA (top 64%) — families likely to look elsewhere, expect single-tenant / working-renter base with shorter leases.
- Zoned schools: Freemansburg El Sch (math 12% / reading 32%, grade F, #1,221 of 1,518 statewide, top 81%, 347 students, 78% FRL); Northeast Ms (math 12% / reading 47%, grade F, #385 of 512 statewide, top 76%, 725 students, 75% FRL); Liberty Hs (math 36% / reading 10%, grade F, #382 of 437 statewide, top 87%, 2,640 students, 50% FRL) — zoned schools average 67% FRL vs 43% district-wide (25 pts higher); higher-poverty schools than district average — tighter screening recommended.
- Zoned-school proficiency averages 25% at this address vs 40% district-wide (-15 pts) — the specific schools serving this property underperform the Bethlehem Area SD average; the district grade overstates school quality for this exact location.
- Watch-outs: built in 1900 — expect roof / HVAC / electrical / plumbing capex.
- Market conditions: Rents rising (+2.6%/yr); 155 active listings in the ZIP; 5 comparable units currently listed for rent nearby; rentals at typical pace (median 23d on market — plan ~3-4 weeks tenant-placement turnaround); 40% of comp listings sitting > 30 days — soft ceiling on asking rent; solid renter incomes; 567 units permitted in Northampton County in 2024 (151 in 5+ unit buildings).
- 2 sale attempts since 19y ago with the ask held roughly flat each time — persistent listings suggest the price (not the market) is what's stuck; bring a comps-based counter.
- At projected returns (-3.0% appreciation + 2.6% rent growth), your $49k cash investment doubles in ~9 years — after that, you're playing with house money.
- Climate carrying-cost: extreme-heat days projected 7→15/yr by 2055 (HVAC capex compounding) — expect insurance premiums to compound above CPI over the hold.
Questions for listing agent
- Built in 1900 — when were the roof, HVAC, electrical panel, plumbing, and water heater last replaced?
- Is there a deadline driving the sale (1031 exchange, divorce, estate, relocation)? That informs how much negotiation room exists.
- Schools are F-rated, which usually means shorter tenancies and higher turnover. Who's the typical renter profile here, and what's been the actual vacancy rate?
- What's the average days-on-market for RENTAL listings here right now (not sales)? A rising rental-DOM trend means longer vacancies and softer asking-rent achievability than the comps imply.
- What's the recent tenant-quality profile in this submarket — average credit score on applications, eviction rate, late-payment / NSF rate, and stable-employment percentage? A property-management company in the area should have these aggregated.
- How much new for-sale + rental construction is in the pipeline within 1–3 miles? Heavy new supply typically softens prices + rents 12–24 months out; constrained supply supports both.
CashFlowRE · CFR-D8ZSZM854Q15S5
· Data 4 weeks ago
cashflowre.app · 2026-05-29