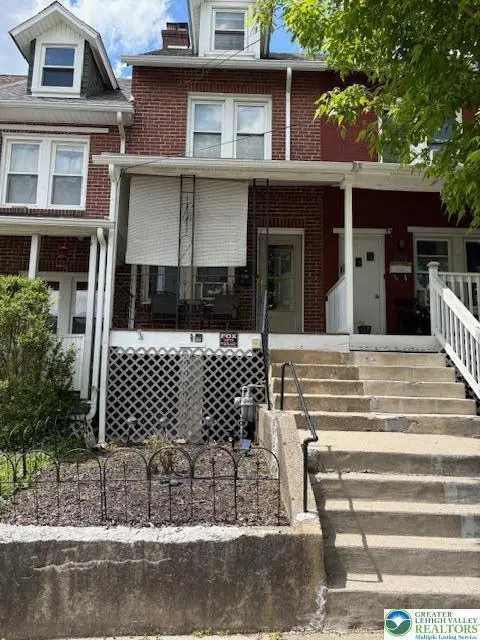
210 Clearfield St · Freemansburg, PA
Flood risk 1/10 · Minimal
- FEMA flood zone
- X (unshaded)
- Chance of flooding over 30 yrs
- 0.0%
- Est. flood insurance / yr
- $473 – $860
Fire risk 3/10 · Minor
- Est. fire insurance / yr
- $511 – $949
Heat risk 5/10 · Moderate
- Hot days now (above 100°F)
- 7 days/yr
- Hot days in 30 yrs
- 15 days/yr
Wind risk 4/10 · Minor
- Chance of severe wind over 30 yrs
- 20.0%
Air-quality risk 3/10 · Minor
- Unhealthy air days now
- 3 days/yr
- Unhealthy air days in 30 yrs
- 4 days/yr
Risk factors via First Street. Map © Google.
Why this score? — see what drove the B+ grade
The composite is a weighted blend of 9 inputs, each scored 0–100. Each bar is that input's sub-score; the figure is the points it added to the 100-point composite (weight × sub-score).
- Cash flow +29.2/30.0
- ARV discount +15.0/15.0
- DSCR +10.0/10.0
- 1% rule +8.0/10.0
- Livability +4.0/5.0
- Schools +3.5/10.0
- Rent growth +3.2/5.0
- Condition / age +2.5/5.0
- Appreciation +0.0/10.0
$175,000
🖨 Deal sheet (PDF) 📄 Offer letter ✓ Due diligence
Listing remarks
Welcome to this three-bedroom, one bath row townhouse in Freemansburg. All major work has been done including a two-year-old roof, all replacement vinyl windows, fenced rear yard with vinyl privacy fencing, plus off-street parking in rear yard off alley. Covered front porch with new trex decking, new storm doors front and rear of the house. Window a/c unit in living room also featuring ceiling fan with remote control. Second floor has master bedroom and one full bath with a combo tub/shower with surround and newer vanity and toilet. Two additional bedrooms on the third floor. Every room has individually controlled electric baseboard heaters. Full basement with outside entrance under the fro
Key facts
- Covered front porch
- Off street parking
- Two year old roof
Tags
Property features AI
Exterior
- Parking: Off-street parking; On-street parking
- Security: Security system
- Utilities: 100 amp electrical service with circuit breakers; Public water; Public sewer
- Home design: 3-story building; Brick and aluminum siding exterior; Asphalt/fiberglass roof; Above-grade finished area approximately 878
- Construction: Brick and aluminum siding construction; Asphalt/fiberglass roof
- Exterior features: Porch; Lot listed as public records
Interior
- Kitchen: Electric oven
- Bedrooms: Total rooms: 5
- Flooring: Carpet; Vinyl
- Bathrooms: 1 full bathroom
- Heating & cooling: Baseboard heating (electric); Ceiling fans; Wall/window air conditioning units
- Interior features: Eat-in kitchen; Full basement with exterior entry; Security system
- Laundry & utility: Electric dryer; Electric dryer hookup on lower level; Electric water heater
Neighborhood map
What this means for you Summary
Snapshot
- This is a 4-bed/1.0-bath single-family listed at $175k.
Deal economics
- At list price, monthly cash flow is $610 ($7k/yr) — positive.
- The deal already cash-flows at list — no discount required.
- Meets the 1% rule at list price ($2k rent vs $175k).
Location & tenants
- Location reads 79/100 on livability (#244 in PA, #2,082 nationally) — a middle-class / working-renter tenant base. Strengths: crime A+, housing A+, health & safety A+; Watch: amenities D, commute F.
- Bethlehem Area SD (urban): math 31% / reading 49% proficiency, ranked #342 of 539 in PA (top 64%) — families likely to look elsewhere, expect single-tenant / working-renter base with shorter leases.
- Zoned schools: Freemansburg El Sch (math 12% / reading 32%, grade F, #1,221 of 1,518 statewide, top 81%, 347 students, 78% FRL); Northeast Ms (math 12% / reading 47%, grade F, #385 of 512 statewide, top 76%, 725 students, 75% FRL); Liberty Hs (math 36% / reading 10%, grade F, #382 of 437 statewide, top 87%, 2,640 students, 50% FRL) — zoned schools average 67% FRL vs 43% district-wide (25 pts higher); higher-poverty schools than district average — tighter screening recommended.
- Zoned-school proficiency averages 25% at this address vs 40% district-wide (-15 pts) — the specific schools serving this property underperform the Bethlehem Area SD average; the district grade overstates school quality for this exact location.
- Market conditions: Rents rising (+2.6%/yr); 153 active listings in the ZIP; 5 comparable units currently listed for rent nearby; rentals at typical pace (median 23d on market — plan ~3-4 weeks tenant-placement turnaround); 40% of comp listings sitting > 30 days — soft ceiling on asking rent; solid renter incomes; 567 units permitted in Northampton County in 2024 (151 in 5+ unit buildings).
Forward outlook
- Local home prices are declining (-3.0%/yr); year-one equity from $1k of loan paydown is wiped out by about $5k of value loss. Plan a longer hold.
- At projected returns (-3.0% appreciation + 2.6% rent growth), your $49k cash investment doubles in ~9 years — after that, you're playing with house money.
Negotiation context
- Only 2 days on market — expect competitive offers; lowballing is unlikely to land.
- 2 sale attempts since 19y ago with the ask held roughly flat each time — persistent listings suggest the price (not the market) is what's stuck; bring a comps-based counter.
Risks & watch-outs
- Watch-outs: built in 1900 — expect roof / HVAC / electrical / plumbing capex.
- Climate carrying-cost: extreme-heat days projected 7→15/yr by 2055 (HVAC capex compounding) — expect insurance premiums to compound above CPI over the hold.
Questions for the listing agent
- Built in 1900 — when were the roof, HVAC, electrical panel, plumbing, and water heater last replaced?
- Is there a deadline driving the sale (1031 exchange, divorce, estate, relocation)? That informs how much negotiation room exists.
- Schools are F-rated, which usually means shorter tenancies and higher turnover. Who's the typical renter profile here, and what's been the actual vacancy rate?
- What's the average days-on-market for RENTAL listings here right now (not sales)? A rising rental-DOM trend means longer vacancies and softer asking-rent achievability than the comps imply.
- What's the recent tenant-quality profile in this submarket — average credit score on applications, eviction rate, late-payment / NSF rate, and stable-employment percentage? A property-management company in the area should have these aggregated.
- How much new for-sale + rental construction is in the pipeline within 1–3 miles? Heavy new supply typically softens prices + rents 12–24 months out; constrained supply supports both.
Investment metrics
- 1% rule
- 1.30% ✓
- Cap rate
- 10.48%
- Cash-on-cash
- 14.94%
- DSCR
- 1.66
- GRM
- 6.4
CMA / ARV
- ARV (median comp)
- $253,083
- List price
- $175,000
- Delta
- -30.85%
- Verdict
- UNDERPRICED
- Comps
- 20 within 1.0 mi
Show comp detail 2 sales within ~0.75 mi
| Address | Dist | Beds/Ba | Sqft | Sold | Price | $/sf | Match |
|---|---|---|---|---|---|---|---|
| 843 Monroe St | 0.12mi | 4/1.0 | 933 (+6%) | 14mo | $274,900 | $295 | 73 |
| 1509 Luzerne St | 0.72mi | 3/1.0 (-1) | 980 (+12%) | 17mo | $255,000 | $260 | 28 |
Match score weights: distance 35% · size 25% · config 20% · recency 20%. Top-matched comps best support the ARV.
Projected returns pro-forma
-3.0% appreciation · 2.6% rent growth · sell at horizon
- IRR
- 5.1%
- Equity multiple
- 1.20×
- Total profit
- $9,605
- Equity at exit
- $26,093
- IRR
- 14.2%
- Equity multiple
- 2.12×
- Total profit
- $54,765
- Equity at exit
- $15,131
Cash invested: $49,000 (down + closing). Projections, not guarantees.
Landlord ↔ Tenant lean methodology
- Overall (STATE)
- 62 Landlord-Friendly
- State Pennsylvania
- 62 Landlord-Friendly · EVEN
- County
- — inherits STATE
- City
- — inherits STATE
ZIP-level market 18017
- Rents YoY
- 2.6%
- Active inventory
- 153
- Price-to-rent
- 6.4×
Monthly cashflow live
- Estimated rent
- $2,273 high interval (Pro) →
- Mortgage (P&I)
- −$918
- Tax from tax record
- −$195 /mo · $2,343/yr
- Insurance
- −$73
- HOA
- −$0
- Vacancy / Maint / Mgmt
- −$477
- Net cashflow
- $610
Break-even live
Sensitivity live
| Price | -10% $709 | -5% $660 | +0% $610 | +5% $561 | +10% $511 |
|---|---|---|---|---|---|
| Rent | -10% $430 | -5% $520 | +0% $610 | +5% $700 | +10% $790 |
| Rate | -1.0pp $698 | -0.5pp $655 | base $610 | +0.5pp $565 | +1.0pp $519 |
UW: 25.0% down · 7.5% · 30yr · 1.5% tax · 5.0% vac · 8.0% maint · 8.0% mgmt
Financing live
Cash to close
- Down payment
- $43,750
- Closing costs
- $5,250
- Reserves months
- —
- Total cash needed
- —
Loan-product check · same deal, 3 products live
Conventional
25% down · 7.5% · 30yr
- Down + closing
- —
- Monthly P&I
- —
- Monthly cashflow
- —
- DSCR
- —
- Eligible?
- —
Personal DTI + credit; lowest rate.
DSCR
20% down · 8.5% · 30yr
- Down + closing
- —
- Monthly P&I
- —
- Monthly cashflow
- —
- DSCR
- —
- Eligible?
- —
No personal income docs; deal must DSCR.
Hard money
10% down · 12.0% · 12mo
- Down + closing
- —
- Monthly P&I
- —
- Monthly cashflow
- —
- DSCR
- —
- Eligible?
- —
Short-term bridge; refi at stabilization.
Rent comps 5 comps
| Address | Beds | Baths | Sqft | Rent | $/sqft | DOM | Units | Dist |
|---|---|---|---|---|---|---|---|---|
| 214 Clearfield St Freemansburg, PA | 3.0 | 1.0 | 966 | $1,700 | $1.76 | 4d | 1 | 0.03mi |
| 1416 Livingston St Bethlehem, PA | 1.0–4.0 | 1.0–2.0 | 1002 | $2,554 | $2.55 | 4d | 20 | 0.58mi |
| 1209 Mechanic St Bethlehem, PA | 3.0 | 1.0 | 1003 | $2,000 | $1.99 | 22d | 1 | 1.22mi |
| 1201 E 4th St Unit 4 Bethlehem, PA | 3.0 | 1.5 | 1100 | $1,800 | $1.64 | 45d | 1 | 1.25mi |
| 746 Linden St Unit 2 Bethlehem, PA | 3.0 | 1.0 | 1008 | $1,975 | $1.96 | 45d | 1 | 1.38mi |
Listing history 4 events
-
2026-05-05status Pending 1006-char remark
-
2026-05-02$175,000 Active 1006-char remark
-
2007-12-17historical
-
2007-09-17$70,000
ⓘ Source: listings_history table (triggers on properties + properties_extension) + one-shot
backfill from property_details.listing_events for pre-trigger history.
Tax reassessment forecast PA · Partial reset (capped growth)
- Current annual tax
- $2,343 · $195/mo
- Projected year-2 tax
- $2,554 · $213/mo
- Expected delta
- +$211/yr (+$18/mo · 9.0%)
ⓘ Screening estimate from a state-policy table — verify with the county assessor before closing.
Climate risk First Street
- Flood 1/10 Low FEMA zone X (unshaded) · 0% chance over 30 yrs
- Wildfire 3/10 Moderate
- Heat 5/10 Major 7 d/yr ≥100°F today · 15 d/yr by 30 yrs out
- Wind 4/10 Moderate 20% chance of damaging wind over 30 yrs
- Air quality 3/10 Moderate 3 unhealthy d/yr today · 4 by 30 yrs out
Nearby sold comps map
Loading sold comps map…
Walkable amenities ~0.75 mi
Loading nearby amenities…
Taxation est. · year 1
- Rental income
- $27,280
- − Mortgage interest
- −$9,803
- − Property taxes
- −$2,343
- − Insurance
- −$875
- − Repairs & maintenance
- −$2,182
- − Management
- −$2,182
- − Depreciation
- −$5,091
- Taxable income
- $4,803
- Est. tax owed @ 24.0%
- −$1,153
- After-tax cash flow
- $6,168/yr
For passive investors: Depreciation is non-cash, so a rental often shows a tax loss while cash-flowing — sheltering income. Rental losses are passive: they offset passive income freely, and up to $25,000/yr can offset ordinary (W-2) income if you actively participate and your MAGI is under $100k (phasing out to $0 by $150k); unused losses carry forward. On sale, claimed depreciation is recaptured at up to 25%, and gains may owe capital-gains tax (a 1031 exchange can defer both). Figures are a year-1 estimate at your 24.0% rate — not tax advice; consult a CPA.
Schools (NCES district)
- District
- Bethlehem Area SD
- NCES district ID
- 4203570
- Math proficiency
- 31% ▼ -2.00%
- Reading proficiency
- 49% ▼ -6.00%
- Median HH income
- $55,124
- Composite
- 34.92/100
- National rank
- #5068
- State rank
- #342 of 539 in PA
Livability — Freemansburg
- Score
- 79/100
- State rank
- #244
- US rank
- #2082
Category grades
Schools grade is shown separately in the Schools card above.
Census & demographics
- Census place
- Freemansburg, PA
- County
- Northampton County · 236,814 people
- Metro
- Allentown-Bethlehem-Easton, PA-NJ
- Population (ZIP)
- 40,640
- Household income
- $91,173
- Rent vs Own
- Severe rent burden
- 950.0
Population outlook (Northampton County) Hauer SSP2
- Today (2025)
- 312,227 people
- By 2030
- 314,769 · +0.8%
- By 2040
- 316,914 · +1.5%
- By 2050
- 318,037 · +1.9%
- By 2075
- 334,003 · +7.0%
- By 2100
- 344,696 · +10.4%
Race, ethnicity, and origin ACS 2023
- Neighborhood character
- Majority White (64%)
- Race & ethnicity
- White 64% Hispanic / Latino 25% Two or more races 14% Black 5% Asian 4%
- Hispanic origin (detail)
- Puerto Rican 16% Dominican 4%
- Common ancestry
- Romanian 4% Polish 2% Lithuanian 1%
- Foreign-born
- 10% · Canada, China, Vietnam
- Languages at home
- 77% English-only · Spanish 15% Other Indo-European 2% French/Haitian/Cajun 1%
Political lean MEDSL · Northampton
- 2024 margin
- Toss-up / Even · D 48.6% · R 50.4%
- 2008→2024 swing
- -14.1pp toward R · 2008: 12.3pp · 2024: -1.8pp
- All cycles
- 2024: R+1.8 2020: D+0.7 2016: R+3.8 2012: D+4.6 2008: D+12.3
Not yet ingested
- Civics
- —
Market trends
- HPI YoY
- ▼ -218.92%
- Current HPI
- 203.0358
- Rent YoY
- ▲ 2.60%
- Metro
- Allentown-Bethlehem-Easton, PA-NJ
- State GDP YoY
- ▲ 1.68%
- F500 in state
- 34
Industry mix (Fortune 500 HQ in PA)
| Industry | F500 HQs | Revenue |
|---|---|---|
| Healthcare | 2 | $309B |
|
||
| Insurance | 2 | $27B |
|
||
| Telecommunications / Media | 1 | $124B |
|
||
| Industrial Distribution | 1 | $22B |
|
||
| Financial Services | 1 | $20B |
|
||
| Chemicals / Materials | 1 | $18B |
|
||
Price history
+150.0% since first listed6 events — show timeline
- 2026-06-09 Sold (Public Records) $175,000 Public Records
- 2026-06-03 Sold (MLS) $175,000 GLVRMLS
- 2026-05-05 Pending — GLVRMLS
- 2026-05-02 Listed $175,000 GLVRMLS
- 2007-12-17 Listing Removed — BRIGHT MLS
- 2007-09-17 Listed $70,000 BRIGHT MLS
Property tax history
+1.8%/yrLatest (2026): $2,343 · +5.2% YoY. Source: county tax records.
Cash-flow waterfall
monthlySold comps — $/sqft
last 12 mo · ≤1 miLoading sold comps…