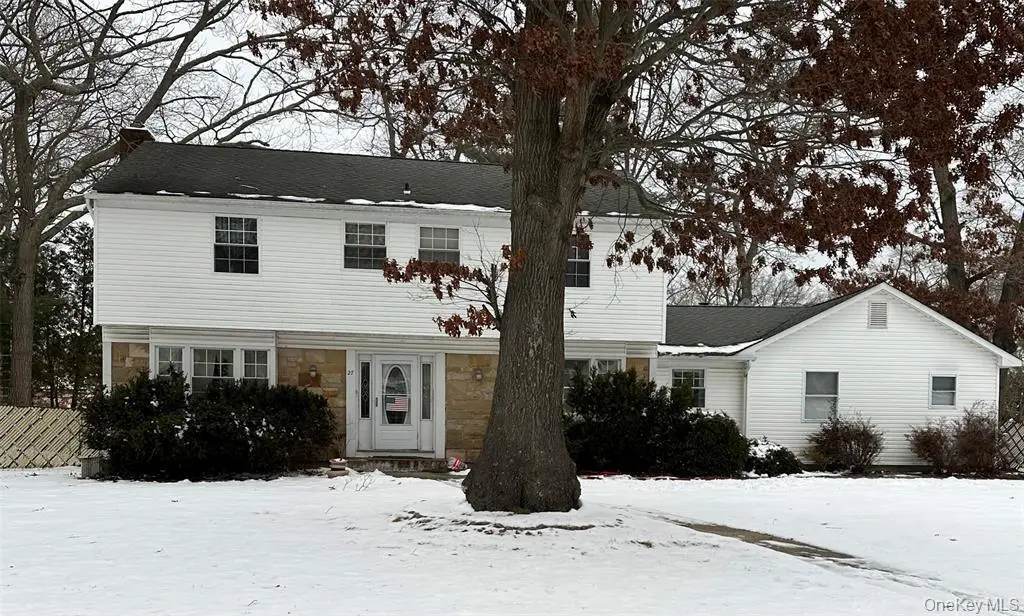
27 Whitmore Ln
Coram, NY 11727
$419,000C
4 bd · 2.0 ba ·
2,172 sqft ·
Built 1968
· SingleFamily
· Active
· 103 DOM
Cashflow @ list (25.0% down · 7.5%)
Estimated rent
$4,654/mo
Mortgage (P&I)
−$2,197
Tax + insurance
−$1,328
HOA
−$0
Vac / Maint / Mgmt
−$977
Net cashflow
$151/mo
Annual
$1,818/yr
Cap rate
6.73%
Cash-on-cash
1.55%
DSCR
1.07
1% rule
1.11%
Cash to close
$117,320
Investor read
- This is a 4-bed/2.0-bath single-family listed at $419k.
- At list price, monthly cash flow is $151 ($2k/yr) — positive.
- The deal already cash-flows at list — no discount required.
- Meets the 1% rule at list price ($5k rent vs $419k).
- It's been on market 103 days — a 9% lower offer ($381k) is reasonable based on typical stale-listing flexibility.
- Recommended offer: $381k (9.0% below list) — sets the bar for market timing.
- Local home prices are declining (-3.0%/yr); year-one equity from $3k of loan paydown is wiped out by about $13k of value loss. Plan a longer hold.
- Location reads 66/100 on livability (#646 in NY) — a middle-class / working-renter tenant base. Strengths: employment A+, housing A+, schools B; Watch: amenities F, commute F, cost of living F.
- Longwood Central School District (rural): math 61% / reading 55% proficiency, ranked #235 of 590 in NY (top 40%) — acceptable for families but not a draw, mixed tenant base, ~2y average lease.
- Watch-outs: property tax is 3.3% of price.
- Market conditions: Rents rising fast (+4.7%/yr); 232 active listings in the ZIP; 4 comparable units currently listed for rent nearby; rentals at typical pace (median 20d on market — plan ~3-4 weeks tenant-placement turnaround); solid renter incomes; 1,366 units permitted in Suffolk County in 2024 (216 in 5+ unit buildings).
- Suffolk County population projected to shrink 5% by 2050 — rents likely to lag national; underwrite the cash flow, not the appreciation.
- 2 sale attempts with the ask held roughly flat each time — persistent listings suggest the price (not the market) is what's stuck; bring a comps-based counter.
- Climate carrying-cost: major wind risk, 77% chance of damaging wind over 30y; extreme-heat days projected 7→17/yr by 2055 (HVAC capex compounding) — expect insurance premiums to compound above CPI over the hold.
- Cap rate 6.7% vs local median 3.5% in Coram — top-decile yield for the area; either an underpriced asset or a hidden risk that comps aren't pricing in. Stress-test before assuming the spread holds.
- At $4,654/mo this rent would consume 54% of the median local household income ($103k/yr) (locally 994% of renters already pay >50% of income on rent) — very limited rent-growth headroom before tenants either downsize or default.
Questions for listing agent
- It's been on market 103 days. Have you received any prior offers? Is the seller open to a 9% concession, seller financing, or rate buy-down credit?
- Built in 1968 — when were the roof, HVAC, electrical panel, plumbing, and water heater last replaced?
- Property tax is high relative to price — has the assessment been appealed recently, and will the sale trigger a re-assessment?
- Why hasn't it sold? Are there any deal-killer items the seller is aware of (foundation, flood, title, zoning, code violations)?
- Is there a deadline driving the sale (1031 exchange, divorce, estate, relocation)? That informs how much negotiation room exists.
- Schools are B-rated — typically a magnet for longer-tenancy family renters. What's the average tenant stay here, and is there a school-zone premium baked into asking?
- What's the average days-on-market for RENTAL listings here right now (not sales)? A rising rental-DOM trend means longer vacancies and softer asking-rent achievability than the comps imply.
- What's the recent tenant-quality profile in this submarket — average credit score on applications, eviction rate, late-payment / NSF rate, and stable-employment percentage? A property-management company in the area should have these aggregated.
CashFlowRE · CFR-D99K3ZFME8GZ6K
· Data 1 week ago
cashflowre.app · 2026-05-29