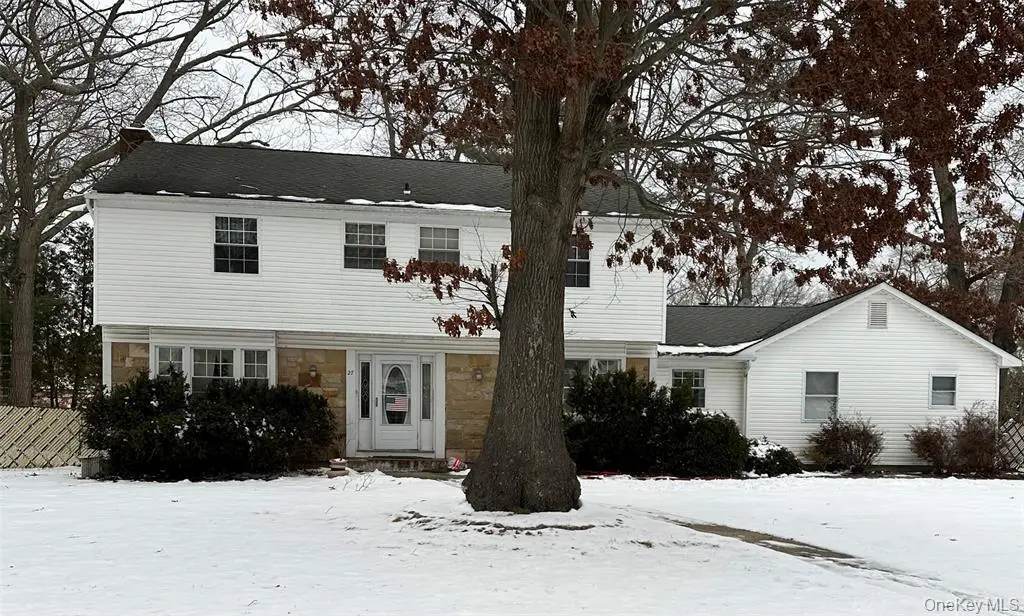
27 Whitmore Ln · Coram, NY
Flood risk 1/10 · Minimal
- FEMA flood zone
- X (unshaded)
- Chance of flooding over 30 yrs
- 0.0%
- Est. flood insurance / yr
- $473 – $860
Fire risk 1/10 · Minimal
- Est. fire insurance / yr
- $691 – $1,283
Heat risk 5/10 · Moderate
- Hot days now (above 94°F)
- 7 days/yr
- Hot days in 30 yrs
- 17 days/yr
Wind risk 6/10 · Moderate
- Chance of severe wind over 30 yrs
- 77.0%
Air-quality risk 4/10 · Minor
- Unhealthy air days now
- 3 days/yr
- Unhealthy air days in 30 yrs
- 5 days/yr
Risk factors via First Street. Map © Google.
Why this score? — see what drove the C grade
The composite is a weighted blend of 9 inputs, each scored 0–100. Each bar is that input's sub-score; the figure is the points it added to the 100-point composite (weight × sub-score).
- Cash flow +15.3/30.0
- ARV discount +15.0/15.0
- 1% rule +6.1/10.0
- Schools +5.2/10.0
- DSCR +4.7/10.0
- Rent growth +3.7/5.0
- Livability +3.3/5.0
- Condition / age +2.5/5.0
- Appreciation +0.0/10.0
$419,000
🖨 Deal sheet (PDF) 📄 Offer letter ✓ Due diligence
Listing remarks MLS
CASH ONLY ! ! ! --- Discover the potential of this classic 4-bedroom, 2.5-bathroom Colonial, perfectly situated on a generous .38-acre lot in the desirable Tanglewood Hills section of Coram. This home features over 2,100 square feet of living space, including a formal living room with a cozy fireplace, a dedicated dining area, and a 2-car attached garage. Located within the esteemed Longwood Central School District (District #392), this property offers a prime location near local shopping, dining and parks. Sold AS-IS subject to any and all tenants and liens. *ALL INFORMATION DEEMED ACCURATE BUT NOT GUARANTEED.
Key facts
- Generous lot
- Formal living room
- Cozy fireplace
Tags
Neighborhood map
What this means for you Summary
Snapshot
- This is a 4-bed/2.0-bath single-family listed at $419k.
Deal economics
- At list price, monthly cash flow is $151 ($2k/yr) — positive.
- The deal already cash-flows at list — no discount required.
- Meets the 1% rule at list price ($5k rent vs $419k).
- Recommended offer: $381k (9.0% below list) — sets the bar for market timing.
- Cap rate 6.7% vs local median 3.5% in Coram — top-decile yield for the area; either an underpriced asset or a hidden risk that comps aren't pricing in. Stress-test before assuming the spread holds.
Location & tenants
- Location reads 66/100 on livability (#646 in NY) — a middle-class / working-renter tenant base. Strengths: employment A+, housing A+, schools B; Watch: amenities F, commute F, cost of living F.
- Longwood Central School District (rural): math 61% / reading 55% proficiency, ranked #235 of 590 in NY (top 40%) — acceptable for families but not a draw, mixed tenant base, ~2y average lease.
- Market conditions: Rents rising fast (+4.7%/yr); 232 active listings in the ZIP; 4 comparable units currently listed for rent nearby; rentals at typical pace (median 20d on market — plan ~3-4 weeks tenant-placement turnaround); solid renter incomes; 1,366 units permitted in Suffolk County in 2024 (216 in 5+ unit buildings).
- At $4,654/mo this rent would consume 54% of the median local household income ($103k/yr) (locally 994% of renters already pay >50% of income on rent) — very limited rent-growth headroom before tenants either downsize or default.
Forward outlook
- Local home prices are declining (-3.0%/yr); year-one equity from $3k of loan paydown is wiped out by about $13k of value loss. Plan a longer hold.
- Suffolk County population projected to shrink 5% by 2050 — rents likely to lag national; underwrite the cash flow, not the appreciation.
Negotiation context
- It's been on market 103 days — a 9% lower offer ($381k) is reasonable based on typical stale-listing flexibility.
- 2 sale attempts with the ask held roughly flat each time — persistent listings suggest the price (not the market) is what's stuck; bring a comps-based counter.
Risks & watch-outs
- Watch-outs: property tax is 3.3% of price.
- Climate carrying-cost: major wind risk, 77% chance of damaging wind over 30y; extreme-heat days projected 7→17/yr by 2055 (HVAC capex compounding) — expect insurance premiums to compound above CPI over the hold.
Questions for the listing agent
- It's been on market 103 days. Have you received any prior offers? Is the seller open to a 9% concession, seller financing, or rate buy-down credit?
- Built in 1968 — when were the roof, HVAC, electrical panel, plumbing, and water heater last replaced?
- Property tax is high relative to price — has the assessment been appealed recently, and will the sale trigger a re-assessment?
- Why hasn't it sold? Are there any deal-killer items the seller is aware of (foundation, flood, title, zoning, code violations)?
- Is there a deadline driving the sale (1031 exchange, divorce, estate, relocation)? That informs how much negotiation room exists.
- Schools are B-rated — typically a magnet for longer-tenancy family renters. What's the average tenant stay here, and is there a school-zone premium baked into asking?
- What's the average days-on-market for RENTAL listings here right now (not sales)? A rising rental-DOM trend means longer vacancies and softer asking-rent achievability than the comps imply.
- What's the recent tenant-quality profile in this submarket — average credit score on applications, eviction rate, late-payment / NSF rate, and stable-employment percentage? A property-management company in the area should have these aggregated.
- How much new for-sale + rental construction is in the pipeline within 1–3 miles? Heavy new supply typically softens prices + rents 12–24 months out; constrained supply supports both.
Investment metrics
- 1% rule
- 1.11% ✓
- Cap rate
- 6.73%
- Cash-on-cash
- 1.55%
- DSCR
- 1.07
- GRM
- 7.5
CMA / ARV
- ARV (median comp)
- $672,168
- List price
- $419,000
- Delta
- -37.66%
- Verdict
- UNDERPRICED
- Comps
- 20 within 1.0 mi
Show comp detail 12 sales within ~0.75 mi
| Address | Dist | Beds/Ba | Sqft | Sold | Price | $/sf | Match |
|---|---|---|---|---|---|---|---|
| 98 Wedgewood Dr | 0.08mi | 4/2.5 | 2,170 (-0%) | 7mo | $650,000 | $300 | 89 |
| 17 Whitmore Ln | 0.10mi | 4/2.0 | 2,200 (+1%) | 6mo | $546,500 | $248 | 88 |
| 123 Wedgewood Dr | 0.21mi | 4/2.5 | 2,170 (-0%) | 3mo | $743,000 | $342 | 86 |
| 48 Glenmere Ln | 0.42mi | 4/2.5 | 2,075 (-4%) | 4mo | $485,000 | $234 | 68 |
| 74 Wedgewood Dr | 0.24mi | 4/2.5 | 1,959 (-10%) | 4mo | $600,000 | $306 | 68 |
| 15 Whitmore Ln | 0.13mi | 3/2.0 (-1) | 1,848 (-15%) | 1mo | $725,000 | $392 | 63 |
| 27 Parkridge Cir | 0.50mi | 4/2.5 | 2,306 (+6%) | 4mo | $619,990 | $269 | 61 |
| 10 Welbourn | 0.43mi | 4/2.0 | 1,922 (-12%) | 7mo | $565,000 | $294 | 55 |
| 27 Wedgewood Dr | 0.73mi | 4/3.0 | 2,227 (+2%) | 4mo | $560,000 | $251 | 54 |
| 10 Woodbine St | 0.37mi | 3/2.0 (-1) | 1,920 (-12%) | 8mo | $700,000 | $365 | 52 |
| 24 Woodbine St | 0.44mi | 3/2.0 (-1) | 1,935 (-11%) | 6mo | $510,000 | $264 | 51 |
| 44 Woodbine St | 0.63mi | 4/1.5 | 1,938 (-11%) | 8mo | $610,000 | $315 | 44 |
Match score weights: distance 35% · size 25% · config 20% · recency 20%. Top-matched comps best support the ARV.
Projected returns pro-forma
-3.0% appreciation · 4.66% rent growth · sell at horizon
- IRR
- -11.5%
- Equity multiple
- 0.57×
- Total profit
- $-49,889
- Equity at exit
- $62,474
- IRR
- 0.5%
- Equity multiple
- 1.04×
- Total profit
- $4,381
- Equity at exit
- $36,227
Cash invested: $117,320 (down + closing). Projections, not guarantees.
Landlord ↔ Tenant lean methodology
- Overall (STATE)
- 15 Strongly Tenant-Friendly
- State New York
- 15 Strongly Tenant-Friendly · D+10
- County
- — inherits STATE
- City
- — inherits STATE
ZIP-level market 11727
- Rents YoY
- 4.7%
- Active inventory
- 232
- Price-to-rent
- 7.5×
Monthly cashflow live
- Estimated rent
- $4,654 medium interval (Pro) →
- Mortgage (P&I)
- −$2,197
- Tax from tax record
- −$1,153 /mo · $13,841/yr
- Insurance
- −$175
- HOA
- −$0
- Vacancy / Maint / Mgmt
- −$977
- Net cashflow
- $151
Break-even live
Sensitivity live
| Price | -10% $389 | -5% $270 | +0% $151 | +5% $33 | +10% $-86 |
|---|---|---|---|---|---|
| Rent | -10% $-216 | -5% $-32 | +0% $151 | +5% $335 | +10% $519 |
| Rate | -1.0pp $362 | -0.5pp $258 | base $151 | +0.5pp $43 | +1.0pp $-68 |
UW: 25.0% down · 7.5% · 30yr · 1.5% tax · 5.0% vac · 8.0% maint · 8.0% mgmt
Financing live
Cash to close
- Down payment
- $104,750
- Closing costs
- $12,570
- Reserves months
- —
- Total cash needed
- —
Loan-product check · same deal, 3 products live
Conventional
25% down · 7.5% · 30yr
- Down + closing
- —
- Monthly P&I
- —
- Monthly cashflow
- —
- DSCR
- —
- Eligible?
- —
Personal DTI + credit; lowest rate.
DSCR
20% down · 8.5% · 30yr
- Down + closing
- —
- Monthly P&I
- —
- Monthly cashflow
- —
- DSCR
- —
- Eligible?
- —
No personal income docs; deal must DSCR.
Hard money
10% down · 12.0% · 12mo
- Down + closing
- —
- Monthly P&I
- —
- Monthly cashflow
- —
- DSCR
- —
- Eligible?
- —
Short-term bridge; refi at stabilization.
Rent comps 4 comps
| Address | Beds | Baths | Sqft | Rent | $/sqft | DOM | Units | Dist |
|---|---|---|---|---|---|---|---|---|
| 7 Wicket St Coram, NY | 4.0 | 4.0 | 2398 | $5,500 | $2.29 | 1d | 1 | 0.75mi |
| 52 Huron St Port Jefferson Station, NY | 3.0 | 2.0 | 2161 | $4,350 | $2.01 | 1d | 1 | 0.88mi |
| 10 Todd Ct Port Jefferson Station, NY | 4.0 | 2.5 | 2217 | $4,500 | $2.03 | 19d | 1 | 1.11mi |
| 11 Oak Pl Selden, NY | 4.0 | 2.0 | 1976 | $4,200 | $2.13 | 22d | 1 | 1.22mi |
Listing history 13 events
-
2026-06-09days on market $419,000 Active 103 DOM
-
2026-06-08days on market $419,000 Active 102 DOM
-
2026-06-07days on market $419,000 Active 101 DOM
-
2026-06-04days on market $419,000 Active 98 DOM
-
2026-06-03days on market $419,000 Active 97 DOM
-
2026-06-02days on market $419,000 Active 96 DOM
-
2026-06-01days on market $419,000 Active 95 DOM
-
2026-05-31days on market $419,000 Active 94 DOM
-
2026-02-26$419,000 Active 618-char remark
Show marketing remark (618 chars)
CASH ONLY ! ! ! --- Discover the potential of this classic 4-bedroom, 2.5-bathroom Colonial, perfectly situated on a generous .38-acre lot in the desirable Tanglewood Hills section of Coram. This home features over 2,100 square feet of living space, including a formal living room with a cozy fireplace, a dedicated dining area, and a 2-car attached garage. Located within the esteemed Longwood Central School District (District #392), this property offers a prime location near local shopping, dining and parks. Sold AS-IS subject to any and all tenants and liens. *ALL INFORMATION DEEMED ACCURATE BUT NOT GUARANTEED.
-
2025-02-14status Pending
-
2025-02-11$499,999 Active
-
2005-09-02soldstatus $420,200
-
2001-06-27soldstatus $202,500
ⓘ Source: listings_history table (triggers on properties + properties_extension) + one-shot
backfill from property_details.listing_events for pre-trigger history.
Tax reassessment forecast NY · Partial reset (capped growth)
- Current annual tax
- $13,841 · $1,153/mo
- Projected year-2 tax
- $13,841 · $1,153/mo
- Expected delta
- $0/yr ($0/mo · 0.0%)
ⓘ Screening estimate from a state-policy table — verify with the county assessor before closing.
Climate risk First Street
- Flood 1/10 Low FEMA zone X (unshaded) · 0% chance over 30 yrs
- Wildfire 1/10 Low
- Heat 5/10 Major 7 d/yr ≥94°F today · 17 d/yr by 30 yrs out
- Wind 6/10 Major 77% chance of damaging wind over 30 yrs
- Air quality 4/10 Moderate 3 unhealthy d/yr today · 5 by 30 yrs out
Nearby sold comps map
Loading sold comps map…
Walkable amenities ~0.75 mi
Loading nearby amenities…
Taxation est. · year 1
- Rental income
- $55,849
- − Mortgage interest
- −$23,471
- − Property taxes
- −$13,841
- − Insurance
- −$2,095
- − Repairs & maintenance
- −$4,468
- − Management
- −$4,468
- − Depreciation
- −$12,189
- Taxable loss
- −$4,682
- Est. tax savings @ 24.0%
- +$1,124
- After-tax cash flow
- $2,941/yr
For passive investors: Depreciation is non-cash, so a rental often shows a tax loss while cash-flowing — sheltering income. Rental losses are passive: they offset passive income freely, and up to $25,000/yr can offset ordinary (W-2) income if you actively participate and your MAGI is under $100k (phasing out to $0 by $150k); unused losses carry forward. On sale, claimed depreciation is recaptured at up to 25%, and gains may owe capital-gains tax (a 1031 exchange can defer both). Figures are a year-1 estimate at your 24.0% rate — not tax advice; consult a CPA.
Schools (NCES district)
- District
- Longwood Central School District
- NCES district ID
- 3619230
- Math proficiency
- 61% ▬ 0.00%
- Reading proficiency
- 55% ▼ -1.00%
- Median HH income
- $72,748
- Composite
- 51.63/100
- National rank
- #1703
- State rank
- #235 of 590 in NY
Livability — Coram
- Score
- 66/100
- State rank
- #646
- US rank
- #12097
Category grades
Schools grade is shown separately in the Schools card above.
Census & demographics
- Census place
- Coram, NY
- County
- Suffolk County · 679,920 people
- City population
- 28,495
- Metro
- New York-Newark-Jersey City, NY-NJ-PA
- Population (ZIP)
- 28,495
- Household income
- $103,287
- Rent vs Own
- Severe rent burden
- 994.0
Population outlook (Suffolk County) Hauer SSP2
- Today (2025)
- 1,505,262 people
- By 2030
- 1,498,318 · -0.5%
- By 2040
- 1,471,101 · -2.3%
- By 2050
- 1,424,848 · -5.3%
- By 2075
- 1,337,157 · -11.2%
- By 2100
- 1,217,720 · -19.1%
Race, ethnicity, and origin ACS 2023
- Neighborhood character
- Diverse neighborhood (Simpson 0.69)
- Race & ethnicity
- White 50% Hispanic / Latino 19% Two or more races 18% Black 15% Asian 6%
- Hispanic origin (detail)
- Mexican 1% Puerto Rican 8% Dominican 4%
- Common ancestry
- Romanian 4% Scotch-Irish 2% Lithuanian 1%
- Foreign-born
- 22% · Canada, South Korea, Jamaica
- Languages at home
- 72% English-only · Spanish 12% Other Indo-European 8% Arabic 2%
Political lean MEDSL · Suffolk
- 2024 margin
- Lean R (+10.0) · D 45.0% · R 55.0%
- 2008→2024 swing
- -16.0pp toward R · 2008: 6.0pp · 2024: -10.0pp
- All cycles
- 2024: R+10.0 2020: R+0.0 2016: R+8.2 2012: D+2.9 2008: D+6.0
Not yet ingested
- Civics
- —
Market trends
- HPI YoY
- ▼ -571.88%
- Current HPI
- 388.8297
- Rent YoY
- ▲ 4.66%
- Metro
- New York-Newark-Jersey City, NY-NJ-PA
- State GDP YoY
- ▲ 2.60%
- F500 in state
- 92
Industry mix (Fortune 500 HQ in NY)
| Industry | F500 HQs | Revenue |
|---|---|---|
| Financial Services | 10 | $950B |
|
||
| Consumer Goods | 9 | $162B |
|
||
| Insurance | 4 | $225B |
|
||
| Telecommunications | 2 | $144B |
|
||
| Pharmaceuticals | 2 | $112B |
|
||
| Media / Entertainment | 2 | $69B |
|
||
Price history
+106.9% since first listed5 events — show timeline
- 2026-02-26 Listed $419,000 OneKey® MLS as Distributed by MLS Grid
- 2025-02-14 Pending — OneKey® MLS as Distributed by MLS Grid
- 2025-02-11 Listed $499,999 OneKey® MLS as Distributed by MLS Grid
- 2005-09-02 Sold (Public Records) $420,200 Public Records
- 2001-06-27 Sold (Public Records) $202,500 Public Records
Property tax history
+3.3%/yrLatest (2025): $13,841 · +0.0% YoY. Source: county tax records.
Cash-flow waterfall
monthlySold comps — $/sqft
last 12 mo · ≤1 miLoading sold comps…