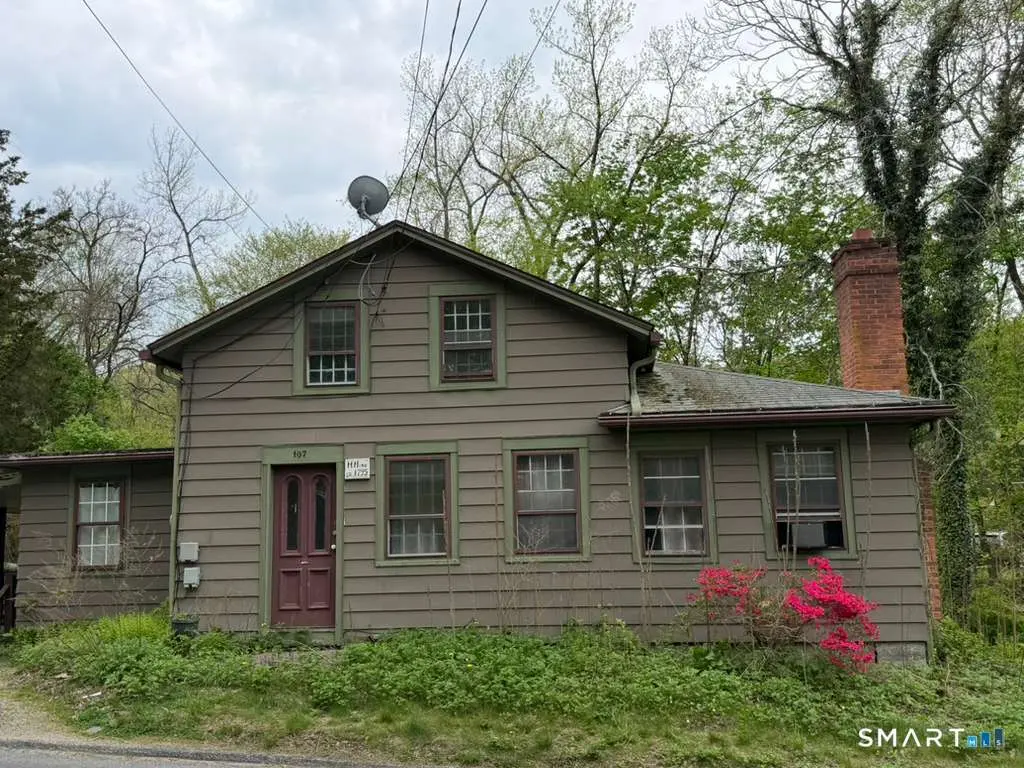
107 West St
Ansonia, CT 06483
$249,900C-
3 bd · 1.0 ba ·
1,131 sqft ·
Built 1764
· SingleFamily
· Under Contract
· 11 DOM
Cashflow @ list (25.0% down · 7.5%)
Estimated rent
$2,258/mo
Mortgage (P&I)
−$1,311
Tax + insurance
−$488
HOA
−$0
Vac / Maint / Mgmt
−$474
Net cashflow
$-15/mo
Annual
$-180/yr
Cap rate
6.22%
Cash-on-cash
-0.26%
DSCR
0.99
1% rule
0.90%
Cash to close
$69,972
Investor read
- This is a 3-bed/1.0-bath single-family listed at $250k.
- At list price, monthly cash flow is $-15 ($-180/yr) — negative.
- To cash-flow at today's rent, offer at most $247k (1.1% below list).
- To meet the 1% rule (rent ≥ 1% of price), the offer needs to be $226k (9.7% below list).
- Only 11 days on market — expect competitive offers; lowballing is unlikely to land.
- Recommended offer: $226k (9.7% below list) — sets the bar for 1% rule.
- Local home prices are declining (-2.4%/yr); year-one equity from $2k of loan paydown is wiped out by about $6k of value loss. Plan a longer hold.
- Location reads 71/100 on livability (#87 in CT) — a middle-class / working-renter tenant base. Strengths: crime A+, health & safety A+, housing A-; Watch: employment C-, schools F, amenities F.
- Seymour School District (suburban): math 34% / reading 50% proficiency, ranked #93 of 153 in CT (top 61%) — families likely to look elsewhere, expect single-tenant / working-renter base with shorter leases; only 19% free/reduced lunch — higher-income household profile.
- Watch-outs: built in 1764 — expect roof / HVAC / electrical / plumbing capex.
- Market conditions: 57 active listings in the ZIP; 13 comparable units currently listed for rent nearby; rentals at typical pace (median 16d on market — plan ~3-4 weeks tenant-placement turnaround); solid renter incomes; 502 units permitted in Naugatuck Valley Planning Region in 2024 (171 in 5+ unit buildings).
- 4 sale attempts since 22y ago with the ask held roughly flat each time — persistent listings suggest the price (not the market) is what's stuck; bring a comps-based counter.
- Climate carrying-cost: major flood risk; major wind risk, 27% chance of damaging wind over 30y; extreme-heat days projected 7→17/yr by 2055 (HVAC capex compounding) — expect insurance premiums to compound above CPI over the hold.
- Cap rate 6.2% vs local median 3.8% in Ansonia — top-decile yield for the area; either an underpriced asset or a hidden risk that comps aren't pricing in. Stress-test before assuming the spread holds.
Questions for listing agent
- What do current leases actually rent for vs. the listed asking? Can we see a recent rent roll and the last 12 months of T-12 income?
- Built in 1764 — when were the roof, HVAC, electrical panel, plumbing, and water heater last replaced?
- Is there a deadline driving the sale (1031 exchange, divorce, estate, relocation)? That informs how much negotiation room exists.
- Schools are F-rated, which usually means shorter tenancies and higher turnover. Who's the typical renter profile here, and what's been the actual vacancy rate?
- What's the average days-on-market for RENTAL listings here right now (not sales)? A rising rental-DOM trend means longer vacancies and softer asking-rent achievability than the comps imply.
- What's the recent tenant-quality profile in this submarket — average credit score on applications, eviction rate, late-payment / NSF rate, and stable-employment percentage? A property-management company in the area should have these aggregated.
- How much new for-sale + rental construction is in the pipeline within 1–3 miles? Heavy new supply typically softens prices + rents 12–24 months out; constrained supply supports both.
CashFlowRE · CFR-D9H1S28ST8AGSF
· Data 3 weeks ago
cashflowre.app · 2026-05-29