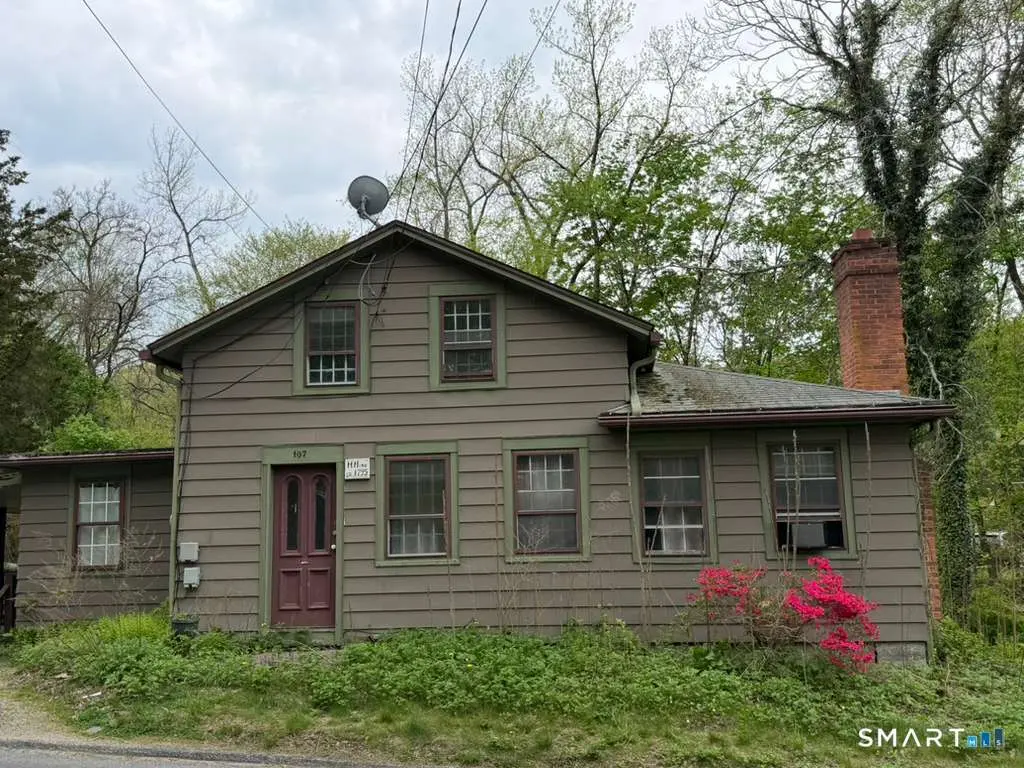
107 West St · Ansonia, CT
Flood risk 6/10 · Moderate
- FEMA flood zone
- X (unshaded)
- Chance of flooding over 30 yrs
- 0.95%
- Est. flood insurance / yr
- $473 – $860
Fire risk 1/10 · Minimal
- Est. fire insurance / yr
- $829 – $1,539
Heat risk 6/10 · Moderate
- Hot days now (above 97°F)
- 7 days/yr
- Hot days in 30 yrs
- 17 days/yr
Wind risk 6/10 · Moderate
- Chance of severe wind over 30 yrs
- 27.0%
Air-quality risk 3/10 · Minor
- Unhealthy air days now
- 3 days/yr
- Unhealthy air days in 30 yrs
- 4 days/yr
Risk factors via First Street. Map © Google.
Why this score? — see what drove the C- grade
The composite is a weighted blend of 9 inputs, each scored 0–100. Each bar is that input's sub-score; the figure is the points it added to the 100-point composite (weight × sub-score).
- ARV discount +15.0/15.0
- Cash flow +13.0/30.0
- 1% rule +4.0/10.0
- DSCR +3.9/10.0
- Appreciation +3.8/10.0
- Schools +3.8/10.0
- Livability +3.6/5.0
- Rent growth +2.5/5.0
- Condition / age +2.5/5.0
$249,900
🖨 Deal sheet (PDF) 📄 Offer letter ✓ Due diligence
Listing remarks MLS
Historical home close to shopping, Route 8, and schools. Large deck leads into the kitchen and dining room which are sun filled rooms on the main level. Main level living room has hardwood floors and a fireplace. Master bedroom is on main level which leads to the second deck overlooking back yard and brook. There are two spacious bedrooms upstairs. Home needs work but well worth the effort, Town of Seymour has a fantastic down town area with eateries, antique shops and pretty waterfalls. Property sold "AS IS"
Key facts
- 0.36 acre lot
- Built 1764
- Listed 11 days
Property features AI
Exterior
- Utilities: Public water connected; Public sewer connected; Electric hot water
- Home design: Single-family home
- Construction: Frame construction; Masonry foundation; Asphalt shingle roof; Brown exterior color; Built (year not provided)
- Exterior features: Aluminum siding; Sloping lot
Interior
- Kitchen: Oven/Range; Refrigerator
- Bedrooms: 3 bedrooms
- Bathrooms: 1 full bathroom
- Heating & cooling: Hot air heating (oil-fired); Oil tank located in basement
- Interior features: One fireplace; Full basement; Walk-up attic
- Laundry & utility: 30-gallon electric hot water tank
Neighborhood map
What this means for you Summary
Snapshot
- This is a 3-bed/1.0-bath single-family listed at $250k.
Deal economics
- At list price, monthly cash flow is $-15 ($-180/yr) — negative.
- To cash-flow at today's rent, offer at most $247k (1.1% below list).
- To meet the 1% rule (rent ≥ 1% of price), the offer needs to be $226k (9.7% below list).
- Recommended offer: $226k (9.7% below list) — sets the bar for 1% rule.
- Cap rate 6.2% vs local median 3.8% in Ansonia — top-decile yield for the area; either an underpriced asset or a hidden risk that comps aren't pricing in. Stress-test before assuming the spread holds.
Location & tenants
- Location reads 71/100 on livability (#87 in CT) — a middle-class / working-renter tenant base. Strengths: crime A+, health & safety A+, housing A-; Watch: employment C-, schools F, amenities F.
- Seymour School District (suburban): math 34% / reading 50% proficiency, ranked #93 of 153 in CT (top 61%) — families likely to look elsewhere, expect single-tenant / working-renter base with shorter leases; only 19% free/reduced lunch — higher-income household profile.
- Market conditions: 55 active listings in the ZIP; 13 comparable units currently listed for rent nearby; rentals at typical pace (median 15d on market — plan ~3-4 weeks tenant-placement turnaround); solid renter incomes; 502 units permitted in Naugatuck Valley Planning Region in 2024 (171 in 5+ unit buildings).
Forward outlook
- Local home prices are declining (-2.4%/yr); year-one equity from $2k of loan paydown is wiped out by about $6k of value loss. Plan a longer hold.
Negotiation context
- Only 11 days on market — expect competitive offers; lowballing is unlikely to land.
- 4 sale attempts since 22y ago with the ask held roughly flat each time — persistent listings suggest the price (not the market) is what's stuck; bring a comps-based counter.
Risks & watch-outs
- Watch-outs: built in 1764 — expect roof / HVAC / electrical / plumbing capex.
- Climate carrying-cost: major flood risk; major wind risk, 27% chance of damaging wind over 30y; extreme-heat days projected 7→17/yr by 2055 (HVAC capex compounding) — expect insurance premiums to compound above CPI over the hold.
Questions for the listing agent
- What do current leases actually rent for vs. the listed asking? Can we see a recent rent roll and the last 12 months of T-12 income?
- Built in 1764 — when were the roof, HVAC, electrical panel, plumbing, and water heater last replaced?
- Is there a deadline driving the sale (1031 exchange, divorce, estate, relocation)? That informs how much negotiation room exists.
- Schools are F-rated, which usually means shorter tenancies and higher turnover. Who's the typical renter profile here, and what's been the actual vacancy rate?
- What's the average days-on-market for RENTAL listings here right now (not sales)? A rising rental-DOM trend means longer vacancies and softer asking-rent achievability than the comps imply.
- What's the recent tenant-quality profile in this submarket — average credit score on applications, eviction rate, late-payment / NSF rate, and stable-employment percentage? A property-management company in the area should have these aggregated.
- How much new for-sale + rental construction is in the pipeline within 1–3 miles? Heavy new supply typically softens prices + rents 12–24 months out; constrained supply supports both.
Investment metrics
- 1% rule
- 0.90% ✗
- Cap rate
- 6.22%
- Cash-on-cash
- -0.26%
- DSCR
- 0.99
- GRM
- 9.2
CMA / ARV
- ARV (median comp)
- $324,303
- List price
- $249,900
- Delta
- -22.94%
- Verdict
- UNDERPRICED
- Comps
- 20 within 1.0 mi
Show comp detail 12 sales within ~0.75 mi
| Address | Dist | Beds/Ba | Sqft | Sold | Price | $/sf | Match |
|---|---|---|---|---|---|---|---|
| 107 West St | 0.00mi | 3/1.0 | 1,153 (+2%) | 1mo | $270,000 | $234 | 96 |
| 33 Swan Ave | 0.27mi | 3/1.5 | 1,086 (-4%) | 11mo | $350,000 | $322 | 69 |
| 32 George St | 0.34mi | 2/1.0 (-1) | 1,030 (-9%) | 2mo | $280,000 | $272 | 62 |
| 38 Sanford St | 0.65mi | 2/1.0 (-1) | 1,156 (+2%) | 5mo | $240,000 | $208 | 57 |
| 235 W Church St | 0.39mi | 2/1.0 (-1) | 1,043 (-8%) | 8mo | $332,000 | $318 | 57 |
| 77 S Main St | 0.59mi | 3/2.0 | 1,080 (-4%) | 6mo | $385,000 | $356 | 56 |
| 118 Washington Ave | 0.55mi | 3/1.5 | 1,170 (+3%) | 14mo | $350,000 | $299 | 55 |
| 20 Cherry St | 0.61mi | 3/2.0 | 1,217 (+8%) | 8mo | $335,000 | $275 | 49 |
| 30 Humphrey St | 0.50mi | 3/1.5 | 1,245 (+10%) | 13mo | $285,000 | $229 | 47 |
| 10 Kulas Ter | 0.60mi | 3/2.0 | 1,268 (+12%) | 5mo | $403,000 | $318 | 43 |
| 69 Emma St | 0.73mi | 3/1.0 | 1,224 (+8%) | 11mo | $335,000 | $274 | 43 |
| 40 Bungay Ter | 0.62mi | 3/2.0 | 1,196 (+6%) | 20mo | $390,000 | $326 | 41 |
Match score weights: distance 35% · size 25% · config 20% · recency 20%. Top-matched comps best support the ARV.
Projected returns pro-forma
-2.41% appreciation · 3.0% rent growth · sell at horizon
- IRR
- -13.3%
- Equity multiple
- 0.50×
- Total profit
- $-35,180
- Equity at exit
- $43,849
- IRR
- -5.2%
- Equity multiple
- 0.63×
- Total profit
- $-26,142
- Equity at exit
- $33,095
Cash invested: $69,972 (down + closing). Projections, not guarantees.
Landlord ↔ Tenant lean methodology
- Overall (STATE)
- 27 Tenant-Leaning
- State Connecticut
- 27 Tenant-Leaning · D+7
- County
- — inherits STATE
- City
- — inherits STATE
ZIP-level market 06483
- Home prices YoY
- -0.8%
- Active inventory
- 55
- Price-to-rent
- 9.2×
Monthly cashflow live
- Estimated rent
- $2,258 high interval (Pro) →
- Mortgage (P&I)
- −$1,311
- Tax from tax record
- −$384 /mo · $4,609/yr
- Insurance
- −$104
- HOA
- −$0
- Vacancy / Maint / Mgmt
- −$474
- Net cashflow
- $-15
Break-even live
Sensitivity live
| Price | -10% $126 | -5% $56 | +0% $-15 | +5% $-86 | +10% $-156 |
|---|---|---|---|---|---|
| Rent | -10% $-193 | -5% $-104 | +0% $-15 | +5% $74 | +10% $163 |
| Rate | -1.0pp $111 | -0.5pp $49 | base $-15 | +0.5pp $-80 | +1.0pp $-146 |
UW: 25.0% down · 7.5% · 30yr · 1.5% tax · 5.0% vac · 8.0% maint · 8.0% mgmt
Financing live
Cash to close
- Down payment
- $62,475
- Closing costs
- $7,497
- Reserves months
- —
- Total cash needed
- —
Loan-product check · same deal, 3 products live
Conventional
25% down · 7.5% · 30yr
- Down + closing
- —
- Monthly P&I
- —
- Monthly cashflow
- —
- DSCR
- —
- Eligible?
- —
Personal DTI + credit; lowest rate.
DSCR
20% down · 8.5% · 30yr
- Down + closing
- —
- Monthly P&I
- —
- Monthly cashflow
- —
- DSCR
- —
- Eligible?
- —
No personal income docs; deal must DSCR.
Hard money
10% down · 12.0% · 12mo
- Down + closing
- —
- Monthly P&I
- —
- Monthly cashflow
- —
- DSCR
- —
- Eligible?
- —
Short-term bridge; refi at stabilization.
Rent comps 13 comps
| Address | Beds | Baths | Sqft | Rent | $/sqft | DOM | Units | Dist |
|---|---|---|---|---|---|---|---|---|
| 68 New St Seymour, CT | 3.0 | 1.5 | 1182 | $2,300 | $1.95 | 44d | 1 | 0.07mi |
| 3 Maple St #7 Seymour, CT | 3.0 | 1.0 | 864 | $2,200 | $2.55 | 15d | 1 | 0.55mi |
| 22 Brook St Seymour, CT | 2.0 | 1.0 | 754 | $2,100 | $2.79 | 15d | 1 | 0.61mi |
| 10 Cherry St Seymour, CT | 2.0 | 1.0 | 850 | $1,700 | $2.00 | 44d | 1 | 0.61mi |
| 85 Balance Rock Rd #14 Seymour, CT | 2.0 | 1.0 | 900 | $2,200 | $2.44 | 3d | 1 | 0.65mi |
| 81 Balance Rock Rd #11 Seymour, CT | 2.0 | 1.0 | 925 | $2,200 | $2.38 | 22d | 1 | 0.67mi |
| 29 Maple St Seymour, CT | 1.0–3.0 | 1.0 | 987 | $2,100 | $2.13 | 3d | 3 | 0.68mi |
| 41 Bissell Pl Seymour, CT | 2.0 | 1.0 | 864 | $2,400 | $2.78 | 22d | 1 | 0.77mi |
| 90-92 Pearl St Seymour, CT | 4.0 | 1.5 | 1500 | $2,895 | $1.93 | 3d | 1 | 0.79mi |
| 41 Balance Rock Rd #9 Seymour, CT | 2.0 | 1.0 | 900 | $1,850 | $2.06 | 3d | 1 | 0.84mi |
| 43 Balance Rock Rd #11 Seymour, CT | 2.0 | 1.0 | 900 | $2,100 | $2.33 | 15d | 1 | 0.87mi |
| 121 North St Unit 5C Seymour, CT | 2.0 | 1.0 | 875 | $1,700 | $1.94 | 44d | 1 | 1.10mi |
| 29 Patton Ave Seymour, CT | 3.0 | 1.0 | 1160 | $2,400 | $2.07 | 3d | 1 | 1.45mi |
Listing history 13 events
-
2026-05-18status Under Contract 447-char remark
-
2026-05-08$249,900 Active 447-char remark
-
2026-05-04historical $249,900 447-char remark
-
2025-01-24historical
-
2024-10-23$239,000 Active
-
2024-10-17historical
-
2022-05-11soldstatus $175,000
-
2022-05-09soldstatus $175,000 Closed
Show marketing remark (525 chars)
Historical home close to shopping, Route 8, and schools. Large deck leads into the kitchen and dining room which are sun filled rooms on the main level. Main level living room has hardwood floors and a fireplace. Master bedroom is on main level which leads to the second deck overlooking back yard and brook. There are two spacious bedrooms upstairs. Home needs work but well worth the effort, Town of Seymour has a fantastic down town area with eateries, antique shops and pretty waterfalls. Property sold "AS IS"
-
2022-03-26historical Under Contract - Continue to Show
Show marketing remark (525 chars)
Historical home close to shopping, Route 8, and schools. Large deck leads into the kitchen and dining room which are sun filled rooms on the main level. Main level living room has hardwood floors and a fireplace. Master bedroom is on main level which leads to the second deck overlooking back yard and brook. There are two spacious bedrooms upstairs. Home needs work but well worth the effort, Town of Seymour has a fantastic down town area with eateries, antique shops and pretty waterfalls. Property sold "AS IS"
-
2022-03-14$175,000 Active
Show marketing remark (525 chars)
Historical home close to shopping, Route 8, and schools. Large deck leads into the kitchen and dining room which are sun filled rooms on the main level. Main level living room has hardwood floors and a fireplace. Master bedroom is on main level which leads to the second deck overlooking back yard and brook. There are two spacious bedrooms upstairs. Home needs work but well worth the effort, Town of Seymour has a fantastic down town area with eateries, antique shops and pretty waterfalls. Property sold "AS IS"
-
2004-12-14soldstatus $164,000
-
2004-12-14soldstatus $164,000
-
2004-09-16$179,900
ⓘ Source: listings_history table (triggers on properties + properties_extension) + one-shot
backfill from property_details.listing_events for pre-trigger history.
Tax reassessment forecast CT · Partial reset (capped growth)
- Current annual tax
- $4,609 · $384/mo
- Projected year-2 tax
- $4,978 · $415/mo
- Expected delta
- +$369/yr (+$31/mo · 8.0%)
ⓘ Screening estimate from a state-policy table — verify with the county assessor before closing.
Climate risk First Street
- Flood 6/10 Major FEMA zone X (unshaded) · 95% chance over 30 yrs
- Wildfire 1/10 Low
- Heat 6/10 Major 7 d/yr ≥97°F today · 17 d/yr by 30 yrs out
- Wind 6/10 Major 27% chance of damaging wind over 30 yrs
- Air quality 3/10 Moderate 3 unhealthy d/yr today · 4 by 30 yrs out
Nearby sold comps map
Loading sold comps map…
Walkable amenities ~0.75 mi
Loading nearby amenities…
Taxation est. · year 1
- Rental income
- $27,094
- − Mortgage interest
- −$13,998
- − Property taxes
- −$4,609
- − Insurance
- −$1,250
- − Repairs & maintenance
- −$2,168
- − Management
- −$2,168
- − Depreciation
- −$7,270
- Taxable loss
- −$4,368
- Est. tax savings @ 24.0%
- +$1,048
- After-tax cash flow
- $868/yr
For passive investors: Depreciation is non-cash, so a rental often shows a tax loss while cash-flowing — sheltering income. Rental losses are passive: they offset passive income freely, and up to $25,000/yr can offset ordinary (W-2) income if you actively participate and your MAGI is under $100k (phasing out to $0 by $150k); unused losses carry forward. On sale, claimed depreciation is recaptured at up to 25%, and gains may owe capital-gains tax (a 1031 exchange can defer both). Figures are a year-1 estimate at your 24.0% rate — not tax advice; consult a CPA.
Schools (NCES district)
- District
- Seymour School District
- NCES district ID
- 0903990
- Math proficiency
- 34% ▼ -13.00%
- Reading proficiency
- 50% ▼ -5.00%
- Median HH income
- $71,700
- Composite
- 38.17/100
- National rank
- #4263
- State rank
- #93 of 153 in CT
Livability — Ansonia
- Score
- 71/100
- State rank
- #87
- US rank
- #6938
Category grades
Schools grade is shown separately in the Schools card above.
Census & demographics
- County
- New Haven County · 688,236 people
- City population
- 19,315
- Metro
- New Haven-Milford, CT
- Population (ZIP)
- 16,889
- Household income
- $107,708
- Rent vs Own
- Severe rent burden
- 221.0
Population outlook (Naugatuck Valley County) Hauer SSP2
- By 2040
- 496,846
Race, ethnicity, and origin ACS 2023
- Neighborhood character
- Predominantly White (67%)
- Race & ethnicity
- White 67% Hispanic / Latino 19% Two or more races 16% Black 7% Asian 2%
- Hispanic origin (detail)
- Mexican 2% Puerto Rican 12%
- Common ancestry
- Romanian 9% Scotch-Irish 3% Lithuanian 2%
- Foreign-born
- 11% · Canada, Dominican Republic
- Languages at home
- 83% English-only · Spanish 10% Russian/Polish/Slavic 3% Other Indo-European 3%
Political lean MEDSL · Naugatuck Valley
- 2024 margin
- Lean R (+7.4) · D 45.6% · R 53.0% · Other 1.4%
- All cycles
- 2024: R+7.4
Not yet ingested
- Civics
- —
Market trends
- HPI YoY
- ▼ -2.41%
- Current HPI
- 294.2705
- Rent YoY
- —
- Metro
- New Haven-Milford, CT
- State GDP YoY
- ▲ 1.06%
- F500 in state
- 38
Industry mix (Fortune 500 HQ in CT)
| Industry | F500 HQs | Revenue |
|---|---|---|
| Industrial Machinery | 4 | $38B |
|
||
| Insurance | 3 | $71B |
|
||
| Financial Services | 2 | $25B |
|
||
| Transportation / Logistics | 2 | $18B |
|
||
| Healthcare | 1 | $247B |
|
||
| Telecommunications | 1 | $55B |
|
||
Price history
+50.1% since first listed14 events — show timeline
- 2026-06-03 Sold (MLS) $270,000 Smart MLS
- 2026-05-18 Pending — Smart MLS
- 2026-05-08 Listed $249,900 Smart MLS
- 2026-05-04 Coming Soon $249,900 Smart MLS
- 2025-01-24 Listing Removed — Smart MLS
- 2024-10-23 Listed $239,000 Smart MLS
- 2024-10-17 Coming Soon — Smart MLS
- 2022-05-11 Sold (Public Records) $175,000 Public Records
- 2022-05-09 Sold (MLS) $175,000 Smart MLS
- 2022-03-26 Contingent — Smart MLS
- 2022-03-14 Listed $175,000 Smart MLS
- 2004-12-14 Sold (Public Records) $164,000 Public Records
- 2004-12-14 Sold (MLS) $164,000 Smart MLS
- 2004-09-16 Listed $179,900 Smart MLS
Property tax history
+2.7%/yrLatest (2023): $4,609 · +1.1% YoY. Source: county tax records.
Cash-flow waterfall
monthlySold comps — $/sqft
last 12 mo · ≤1 miLoading sold comps…