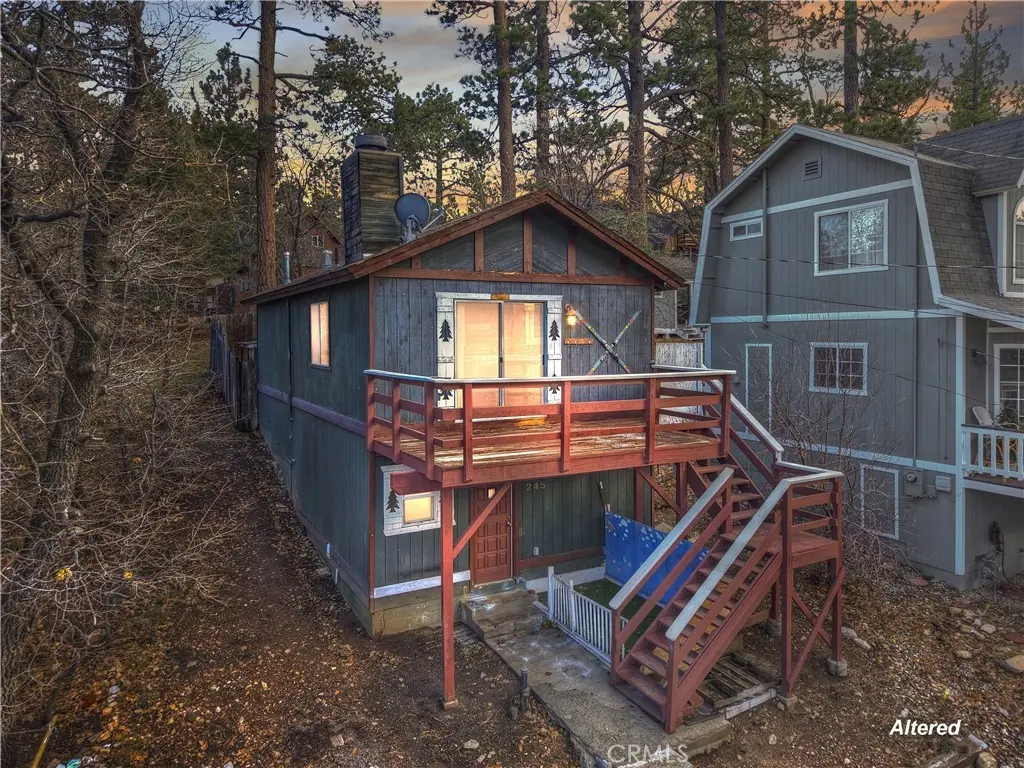
245 Vista
Big Bear City, CA 92386
$199,900D+
2 bd · 1.0 ba ·
954 sqft ·
Built 1978
· SingleFamily
· Active
· 1 DOM
Cashflow @ list (25.0% down · 7.5%)
Estimated rent
$1,862/mo
Mortgage (P&I)
−$1,048
Tax + insurance
−$354
HOA
−$0
Vac / Maint / Mgmt
−$391
Net cashflow
$69/mo
Annual
$833/yr
Cap rate
6.71%
Cash-on-cash
1.49%
DSCR
1.07
1% rule
0.93%
Cash to close
$55,972
Investor read
- This is a 2-bed/1.0-bath single-family listed at $200k.
- At list price, monthly cash flow is $69 ($833/yr) — positive.
- The deal already cash-flows at list — no discount required.
- To meet the 1% rule (rent ≥ 1% of price), the offer needs to be $186k (6.8% below list).
- Only 1 days on market — expect competitive offers; lowballing is unlikely to land.
- Recommended offer: $186k (6.8% below list) — sets the bar for 1% rule.
- Local home prices are declining (-3.0%/yr); year-one equity from $1k of loan paydown is wiped out by about $6k of value loss. Plan a longer hold.
- Location reads 52/100 on livability (#988 in CA) — a working-class tenant base; expect higher turnover. Strengths: housing B; Watch: schools D+, crime F, amenities F.
- Bear Valley Unified (town): math 26% / reading 43% proficiency, ranked #289 of 517 in CA (top 56%) — families likely to look elsewhere, expect single-tenant / working-renter base with shorter leases.
- Market conditions: 117 active listings in the ZIP; 23 comparable units currently listed for rent nearby; rentals lingering (median 44d on market — plan ~5-8 weeks vacancy on turnover, expect pricing pressure); 61% of comp listings sitting > 30 days — soft ceiling on asking rent; 5,458 units permitted in San Bernardino County in 2024 (1,500 in 5+ unit buildings).
- San Bernardino County population projected at +15% by 2050 — modest demand growth; plan on rents tracking national, not racing it.
- 8 sale attempts since 12y ago; this cycle's ask has dropped $80k (29%) from the opening price — seller is motivated, your offer sets the floor, not the list.
- Current owner paid $148k; 36% above their basis — modest negotiation headroom, anchor on the comps not their cost.
- Climate carrying-cost: major wildfire risk — expect insurance premiums to compound above CPI over the hold.
- Cap rate 6.7% vs local median 3.3% in Big Bear City — top-decile yield for the area; either an underpriced asset or a hidden risk that comps aren't pricing in. Stress-test before assuming the spread holds.
- This rent runs 44% of the median local income ($51k/yr) — at the standard rent-burdened threshold; future hikes will face affordability resistance.
Questions for listing agent
- Built in 1978 — when were the roof, HVAC, electrical panel, plumbing, and water heater last replaced?
- Is there a deadline driving the sale (1031 exchange, divorce, estate, relocation)? That informs how much negotiation room exists.
- Schools are D-rated, which usually means shorter tenancies and higher turnover. Who's the typical renter profile here, and what's been the actual vacancy rate?
- Crime grade is F in this area — have there been break-ins, vandalism, or insurance claims at this property in the last 3 years? What carrier currently insures it and at what premium?
- The area grade is low — what's the realistic commute time and amenity access for the typical tenant pool here? Any planned neighborhood developments (good or bad) we should know about?
- What's the average days-on-market for RENTAL listings here right now (not sales)? A rising rental-DOM trend means longer vacancies and softer asking-rent achievability than the comps imply.
- What's the recent tenant-quality profile in this submarket — average credit score on applications, eviction rate, late-payment / NSF rate, and stable-employment percentage? A property-management company in the area should have these aggregated.
- How much new for-sale + rental construction is in the pipeline within 1–3 miles? Heavy new supply typically softens prices + rents 12–24 months out; constrained supply supports both.
CashFlowRE · CFR-DC8DRHBW6YRN4X
· Data 2 days ago
cashflowre.app · 2026-05-29