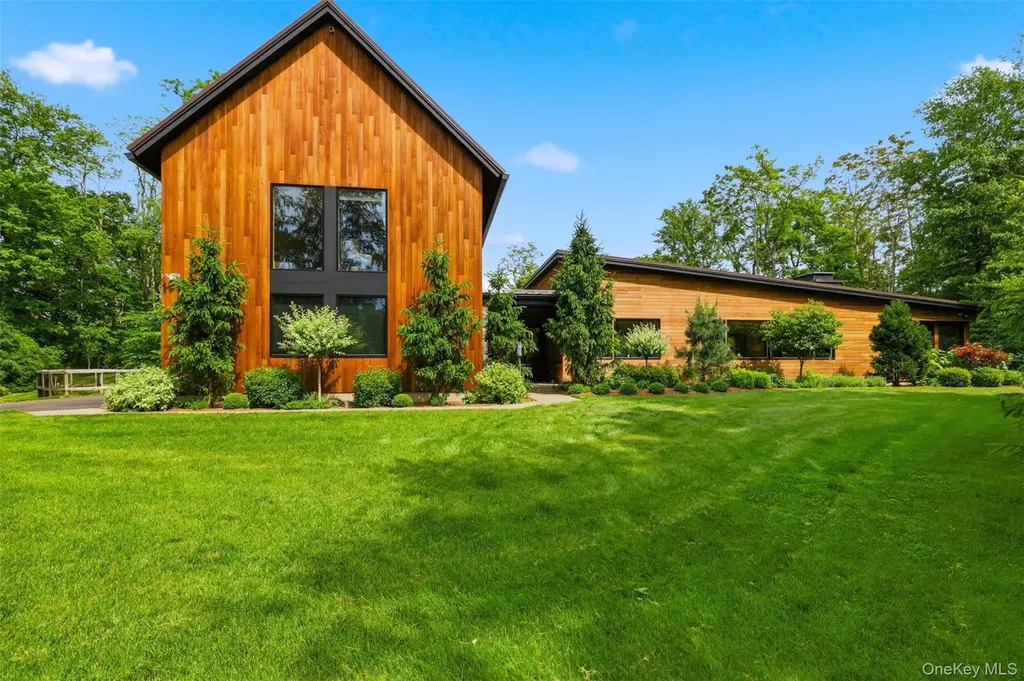
44 Woodlands Trl
Salt Point, NY 12514
$2,150,000C+
3 bd · 2.5 ba ·
3,060 sqft ·
Built 2018
· SingleFamily
· Active
· 1 DOM
Cashflow @ list (25.0% down · 7.5%)
Estimated rent
$22,000/mo
Mortgage (P&I)
−$11,275
Tax + insurance
−$2,406
HOA
−$0
Vac / Maint / Mgmt
−$4,620
Net cashflow
$3,699/mo
Annual
$44,388/yr
Cap rate
8.36%
Cash-on-cash
7.37%
DSCR
1.33
1% rule
1.02%
Cash to close
$602,000
Investor read
- This is a 3-bed/2.5-bath single-family listed at $2.15M.
- At list price, monthly cash flow is $4k ($44k/yr) — positive.
- The deal already cash-flows at list — no discount required.
- Meets the 1% rule at list price ($22k rent vs $2.15M).
- Only 1 days on market — expect competitive offers; lowballing is unlikely to land.
- In year one you build about $230k of equity ($15k loan paydown + $215k appreciation (10.0% local appreciation)).
- Location reads 34/100 on livability (#1,193 in NY) — a limited-amenity area; tenant pool skews transient or value-seeking. Strengths: crime A; Watch: amenities F, commute F, employment F.
- Hyde Park Central School District (rural): math 43% / reading 62% proficiency, ranked #316 of 590 in NY (top 54%) — acceptable for families but not a draw, mixed tenant base, ~2y average lease.
- Zoned schools: Violet Avenue School (math 27% / reading 47%, grade F, #1,519 of 2,108 statewide, top 74%, 314 students, 65% FRL); Haviland Middle School (math 23% / reading 57%, grade F, #413 of 729 statewide, top 57%, 759 students, 59% FRL); Franklin D Roosevelt Senior High School (math 93% / reading 90%, grade A+, #197 of 1,100 statewide, top 18%, 1,136 students, 52% FRL) — zoned schools average 59% FRL vs 34% district-wide (25 pts higher); higher-poverty schools than district average — tighter screening recommended.
- Market conditions: 37 active listings in the ZIP; 1 comparable units currently listed for rent nearby; 620 units permitted in Dutchess County in 2024 (242 in 5+ unit buildings).
- Dutchess County population projected at -11% by 2050 — secular population decline; favor cash flow + early exit over multi-decade hold.
- 7 sale attempts since 18y ago with the ask held roughly flat each time — persistent listings suggest the price (not the market) is what's stuck; bring a comps-based counter.
- At projected returns (10.0% appreciation + 3.0% rent growth), your $602k cash investment doubles in ~3 years — after that, you're playing with house money.
- By year 2, paydown + projected appreciation supports a ~$370k cash-out refi (75% LTV) — recoverable capital for the next deal without selling this one.
- Cap rate 8.4% vs local median 2.3% in Salt Point — top-decile yield for the area; either an underpriced asset or a hidden risk that comps aren't pricing in. Stress-test before assuming the spread holds.
Questions for listing agent
- Is there a deadline driving the sale (1031 exchange, divorce, estate, relocation)? That informs how much negotiation room exists.
- Schools are F-rated, which usually means shorter tenancies and higher turnover. Who's the typical renter profile here, and what's been the actual vacancy rate?
- What's the average days-on-market for RENTAL listings here right now (not sales)? A rising rental-DOM trend means longer vacancies and softer asking-rent achievability than the comps imply.
- What's the recent tenant-quality profile in this submarket — average credit score on applications, eviction rate, late-payment / NSF rate, and stable-employment percentage? A property-management company in the area should have these aggregated.
- How much new for-sale + rental construction is in the pipeline within 1–3 miles? Heavy new supply typically softens prices + rents 12–24 months out; constrained supply supports both.
CashFlowRE · CFR-DCF1590NWPMTBM
· Data 2 days ago
cashflowre.app · 2026-05-29