44 Woodlands Trl · Salt Point, NY
Flood risk 1/10 · Minimal
- FEMA flood zone
- X (unshaded)
- Chance of flooding over 30 yrs
- 0.0%
- Est. flood insurance / yr
- $507 – $1,088
Fire risk 4/10 · Minor
- Est. fire insurance / yr
- $691 – $1,283
Heat risk 3/10 · Minor
- Hot days now (above 97°F)
- 6 days/yr
- Hot days in 30 yrs
- 12 days/yr
Wind risk 4/10 · Minor
- Chance of severe wind over 30 yrs
- 11.0%
Air-quality risk 2/10 · Minimal
- Unhealthy air days now
- 1 days/yr
- Unhealthy air days in 30 yrs
- 3 days/yr
Risk factors via First Street. Map © Google.
Why this score? — see what drove the C+ grade
The composite is a weighted blend of 9 inputs, each scored 0–100. Each bar is that input's sub-score; the figure is the points it added to the 100-point composite (weight × sub-score).
- Cash flow +22.7/30.0
- Appreciation +10.0/10.0
- ARV discount +7.5/15.0
- DSCR +7.3/10.0
- 1% rule +5.2/10.0
- Schools +4.7/10.0
- Rent growth +2.5/5.0
- Condition / age +2.5/5.0
- Livability +1.7/5.0
$2,150,000
🖨 Deal sheet 📄 Offer letter ✓ Due diligence
Listing remarks
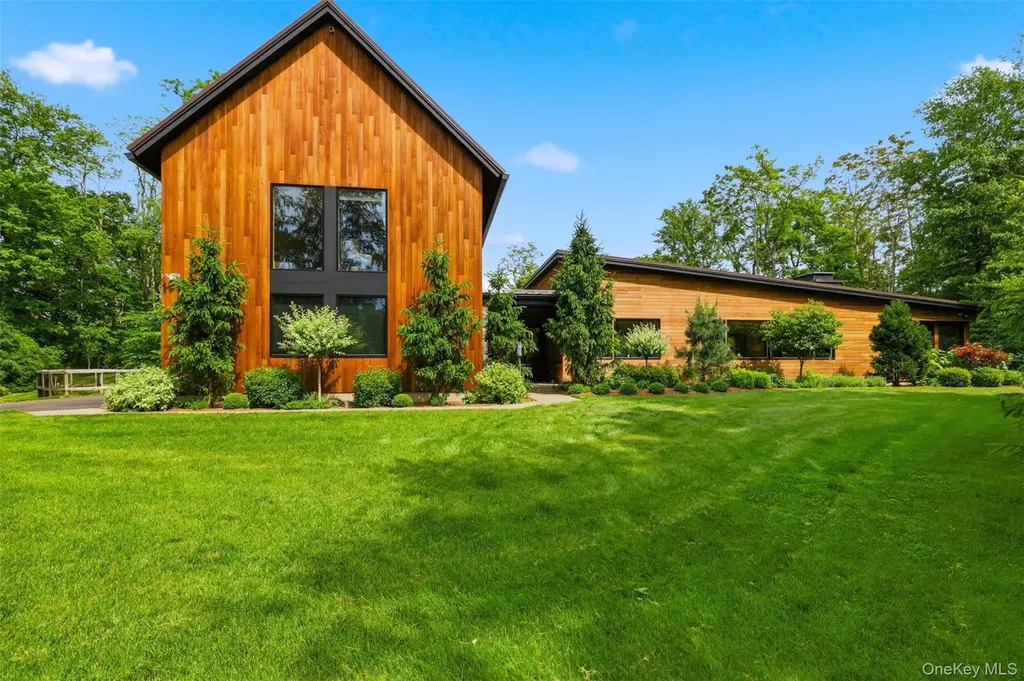
Modern Design. Sustainable Living. Hudson Valley Serenity. Tucked away on 5.41 private acres in the heart of Clinton Corners, this custom-built contemporary retreat seamlessly blends modern architecture, energy efficiency, and a deep connection to nature. Thoughtfully designed for today's lifestyle, the home offers more than 3,000 square feet of light-filled living space surrounded by mature trees, curated landscaping, and peaceful Hudson Valley scenery. The home's striking Western Red Cedar exterior, standing seam metal roof, and clean architectural lines create an immediate sense of arrival. Inside, polished radiant-heated concrete floors, soaring vaulted ceilings, and expansive windows e
Key facts
- Expansive windows
- Open-concept kitchen
- Chef's kitchen
Tags
Property features AI
Exterior
- Parking: Attached garage; 2-car garage; Driveway; Off-street parking; Private parking; Electric vehicle charging station(s)
- Utilities: Electric service by Central Hudson; Septic tank; Utilities: See remarks
- Home design: Single family residence; Two levels
- Construction: Energy Star construction; Wood siding construction
- Exterior features: Wood siding; Not waterfront
Interior
- Kitchen: Kitchen island; Eat-in kitchen; Open kitchen; Dishwasher; Oven; Range; Refrigerator
- Bedrooms: Two levels (total rooms suggest multiple bedrooms); First-floor bedroom included
- Bathrooms: 2 full bathrooms; 1 half bathroom
- Heating & cooling: Central air conditioning; Heat pump; Radiant heating
- Interior features: First-floor bedroom; Eat-in kitchen; High ceilings; High-speed internet; Kitchen island; Natural woodwork; Open floorplan; Open kitchen; Original details; Primary bathroom; Quartz/Quartzite counters; Walk-in closet(s); Washer/dryer hookup
- Laundry & utility: Laundry room inside; Washer hookup; Dryer included
Neighborhood map
What this means for you Summary
Snapshot
- This is a 3-bed/2.5-bath single-family listed at $2.15M.
Deal economics
- At list price, monthly cash flow is $4k ($44k/yr) — positive.
- The deal already cash-flows at list — no discount required.
- Meets the 1% rule at list price ($22k rent vs $2.15M).
- Cap rate 8.4% vs local median 2.3% in Salt Point — top-decile yield for the area; either an underpriced asset or a hidden risk that comps aren't pricing in. Stress-test before assuming the spread holds.
Location & tenants
- Location reads 34/100 on livability (#1,193 in NY) — a limited-amenity area; tenant pool skews transient or value-seeking. Strengths: crime A; Watch: amenities F, commute F, employment F.
- Hyde Park Central School District (rural): math 43% / reading 62% proficiency, ranked #316 of 590 in NY (top 54%) — acceptable for families but not a draw, mixed tenant base, ~2y average lease.
- Zoned schools: Violet Avenue School (math 27% / reading 47%, grade F, #1,519 of 2,108 statewide, top 74%, 314 students, 65% FRL); Haviland Middle School (math 23% / reading 57%, grade F, #413 of 729 statewide, top 57%, 759 students, 59% FRL); Franklin D Roosevelt Senior High School (math 93% / reading 90%, grade A+, #197 of 1,100 statewide, top 18%, 1,136 students, 52% FRL) — zoned schools average 59% FRL vs 34% district-wide (25 pts higher); higher-poverty schools than district average — tighter screening recommended.
- Market conditions: 37 active listings in the ZIP; 1 comparable units currently listed for rent nearby; 620 units permitted in Dutchess County in 2024 (242 in 5+ unit buildings).
Forward outlook
- In year one you build about $230k of equity ($15k loan paydown + $215k appreciation (10.0% local appreciation)).
- Dutchess County population projected at -11% by 2050 — secular population decline; favor cash flow + early exit over multi-decade hold.
- At projected returns (10.0% appreciation + 3.0% rent growth), your $602k cash investment doubles in ~3 years — after that, you're playing with house money.
- By year 2, paydown + projected appreciation supports a ~$370k cash-out refi (75% LTV) — recoverable capital for the next deal without selling this one.
Negotiation context
- Only 1 days on market — expect competitive offers; lowballing is unlikely to land.
- 7 sale attempts since 18y ago with the ask held roughly flat each time — persistent listings suggest the price (not the market) is what's stuck; bring a comps-based counter.
Questions for the listing agent
- Is there a deadline driving the sale (1031 exchange, divorce, estate, relocation)? That informs how much negotiation room exists.
- Schools are F-rated, which usually means shorter tenancies and higher turnover. Who's the typical renter profile here, and what's been the actual vacancy rate?
- What's the average days-on-market for RENTAL listings here right now (not sales)? A rising rental-DOM trend means longer vacancies and softer asking-rent achievability than the comps imply.
- What's the recent tenant-quality profile in this submarket — average credit score on applications, eviction rate, late-payment / NSF rate, and stable-employment percentage? A property-management company in the area should have these aggregated.
- How much new for-sale + rental construction is in the pipeline within 1–3 miles? Heavy new supply typically softens prices + rents 12–24 months out; constrained supply supports both.
Investment metrics
- 1% rule
- 1.02% ✓
- Cap rate
- 8.36%
- Cash-on-cash
- 7.37%
- DSCR
- 1.33
- GRM
- 8.1
CMA / ARV
No comps found within radius.
Projected returns pro-forma
10.0% appreciation · 3.0% rent growth · sell at horizon
- IRR
- 29.6%
- Equity multiple
- 3.34×
- Total profit
- $1,406,146
- Equity at exit
- $1,936,890
- IRR
- 25.7%
- Equity multiple
- 7.57×
- Total profit
- $3,954,823
- Equity at exit
- $4,176,977
Cash invested: $602,000 (down + closing). Projections, not guarantees.
Landlord ↔ Tenant lean methodology
- Overall (STATE)
- 15 Strongly Tenant-Friendly
- State New York
- 15 Strongly Tenant-Friendly · D+10
- County
- — inherits STATE
- City
- — inherits STATE
ZIP-level market 12514
- Home prices YoY
- 11.6%
- Active inventory
- 37
- Price-to-rent
- 8.1×
Monthly cashflow live
- Estimated rent
- $22,000 medium interval (Pro) →
- Mortgage (P&I)
- −$11,275
- Tax from tax record
- −$1,510 /mo · $18,124/yr
- Insurance
- −$896
- HOA
- −$0
- Vacancy / Maint / Mgmt
- −$4,620
- Net cashflow
- $3,699
Break-even live
UW: 25.0% down · 7.5% · 30yr · 1.5% tax · 5.0% vac · 8.0% maint · 8.0% mgmt
Financing live
Cash to close
- Down payment
- $537,500
- Closing costs
- $64,500
- Reserves months
- —
- Total cash needed
- —
Loan-product check · same deal, 3 products live
Conventional
25% down · 7.5% · 30yr
- Down + closing
- —
- Monthly P&I
- —
- Monthly cashflow
- —
- DSCR
- —
- Eligible?
- —
Personal DTI + credit; lowest rate.
DSCR
20% down · 8.5% · 30yr
- Down + closing
- —
- Monthly P&I
- —
- Monthly cashflow
- —
- DSCR
- —
- Eligible?
- —
No personal income docs; deal must DSCR.
Hard money
10% down · 12.0% · 12mo
- Down + closing
- —
- Monthly P&I
- —
- Monthly cashflow
- —
- DSCR
- —
- Eligible?
- —
Short-term bridge; refi at stabilization.
Rent comps 1 comps
| Address | Beds | Baths | Sqft | Rent | $/sqft | DOM | Units | Dist |
|---|---|---|---|---|---|---|---|---|
| 1282 Hollow Rd Clinton Corners, NY | 4.0 | 3.5 | 2650 | $22,000 | $8.30 | 13d | 1 | 0.45mi |
Listing history 2 events
-
2026-06-18remarks 699-char remark
-
2026-06-18$2,150,000 Active 1 DOM
ⓘ Source: listings_history table (triggers on properties + properties_extension) + one-shot
backfill from property_details.listing_events for pre-trigger history.
Tax reassessment forecast NY · Partial reset (capped growth)
- Current annual tax
- $18,124 · $1,510/mo
- Projected year-2 tax
- $27,230 · $2,269/mo
- Expected delta
- +$9,105/yr (+$759/mo · 50.2%)
ⓘ Screening estimate from a state-policy table — verify with the county assessor before closing.
Climate risk First Street
- Flood 1/10 Low FEMA zone X (unshaded) · 0% chance over 30 yrs
- Wildfire 4/10 Moderate
- Heat 3/10 Moderate 6 d/yr ≥97°F today · 12 d/yr by 30 yrs out
- Wind 4/10 Moderate 11% chance of damaging wind over 30 yrs
- Air quality 2/10 Low 1 unhealthy d/yr today · 3 by 30 yrs out
Nearby sold comps map
Loading sold comps map…
Walkable amenities ~0.75 mi
Loading nearby amenities…
Taxation est. · year 1
- Rental income
- $264,000
- − Mortgage interest
- −$120,433
- − Property taxes
- −$18,124
- − Insurance
- −$10,750
- − Repairs & maintenance
- −$21,120
- − Management
- −$21,120
- − Depreciation
- −$62,545
- Taxable income
- $9,907
- Est. tax owed @ 24.0%
- −$2,378
- After-tax cash flow
- $42,010/yr
For passive investors: Depreciation is non-cash, so a rental often shows a tax loss while cash-flowing — sheltering income. Rental losses are passive: they offset passive income freely, and up to $25,000/yr can offset ordinary (W-2) income if you actively participate and your MAGI is under $100k (phasing out to $0 by $150k); unused losses carry forward. On sale, claimed depreciation is recaptured at up to 25%, and gains may owe capital-gains tax (a 1031 exchange can defer both). Figures are a year-1 estimate at your 24.0% rate — not tax advice; consult a CPA.
Schools (NCES district)
- District
- Hyde Park Central School District
- NCES district ID
- 3615180
- Math proficiency
- 43% ▼ -3.00%
- Reading proficiency
- 62% ▲ 15.00%
- Median HH income
- $68,932
- Composite
- 46.59/100
- National rank
- #2421
- State rank
- #316 of 590 in NY
Livability — Salt Point
- Score
- 34/100
- State rank
- #1193
- US rank
- #27748
Category grades
Schools grade is shown separately in the Schools card above.
Census & demographics
- City population
- 2,306
- Population (ZIP)
- 3,120
Population outlook (Dutchess County) Hauer SSP2
- Today (2025)
- 291,768 people
- By 2030
- 287,131 · -1.6%
- By 2040
- 274,881 · -5.8%
- By 2050
- 259,971 · -10.9%
- By 2075
- 235,366 · -19.3%
- By 2100
- 208,786 · -28.4%
Race, ethnicity, and origin ACS 2023
- Neighborhood character
- Predominantly White (94%)
- Race & ethnicity
- White 94% Hispanic / Latino 3% Two or more races 2% Asian 1%
- Common ancestry
- Romanian 5% Portuguese 4% Scotch-Irish 3%
- Foreign-born
- 3% · Canada
- Languages at home
- 97% English-only · Other Asian/Pacific 1% French/Haitian/Cajun 1% Other Indo-European 0%
Political lean MEDSL · Dutchess
- 2024 margin
- Lean D (+5.4) · D 52.7% · R 47.3%
- 2008→2024 swing
- -3.2pp toward R · 2008: 8.6pp · 2024: 5.4pp
- All cycles
- 2024: D+5.4 2020: D+9.6 2016: R+1.1 2012: D+6.6 2008: D+8.6
Not yet ingested
- Civics
- —
Market trends
- HPI YoY
- ▲ 31.24%
- Current HPI
- 300.533
- Rent YoY
- —
- Metro
- —
- State GDP YoY
- ▲ 2.60%
- F500 in state
- 92
Industry mix (Fortune 500 HQ in NY)
| Industry | F500 HQs | Revenue |
|---|---|---|
| Financial Services | 10 | $950B |
|
||
| Consumer Goods | 9 | $162B |
|
||
| Insurance | 4 | $225B |
|
||
| Telecommunications | 2 | $144B |
|
||
| Pharmaceuticals | 2 | $112B |
|
||
| Media / Entertainment | 2 | $69B |
|
||
Price history
13 events — show timeline
- 2026-06-17 Listed $2,150,000 OneKey® MLS as Distributed by MLS Grid
- 2015-03-16 Delisted — HGMLS
- 2014-09-08 Listed — HGMLS
- 2014-08-08 Delisted — HGMLS
- 2014-04-05 Listed — HGMLS
- 2012-07-31 Delisted — HGMLS
- 2011-07-21 Listed — HGMLS
- 2011-03-15 Delisted — HGMLS
- 2010-07-30 Listed — HGMLS
- 2010-07-15 Delisted — HGMLS
- 2009-04-15 Listed — HGMLS
- 2009-01-15 Delisted — HGMLS
- 2008-03-26 Listed — HGMLS
Property tax history
+16.5%/yrLatest (2025): $18,124 · +3.7% YoY. Source: county tax records.
Cash-flow waterfall
monthlySold comps — $/sqft
last 12 mo · ≤1 miLoading sold comps…