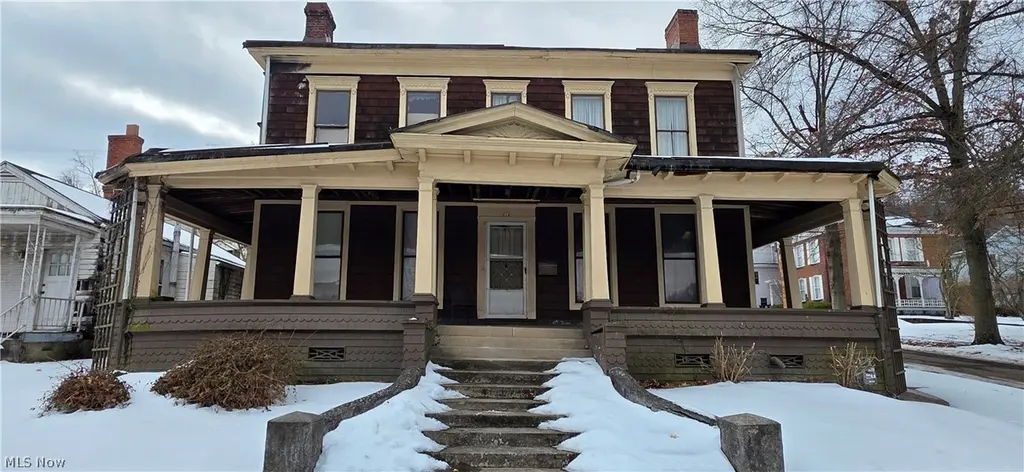
219 Whitely St
Bridgeport, OH 43912
$45,000C
4 bd · 2.0 ba ·
3,164 sqft ·
Built 1880
· MultiFamily
· Active
· 70 DOM
Cashflow @ list (25.0% down · 7.5%)
Estimated rent
$11,720/mo
Mortgage (P&I)
−$236
Tax + insurance
−$131
HOA
−$0
Vac / Maint / Mgmt
−$2,461
Net cashflow
$8,892/mo
Annual
$106,707/yr
Cap rate
244.90%
Cash-on-cash
852.17%
DSCR
38.92
1% rule
26.04%
Cash to close
$12,600
Investor read
- This is a 4-bed/2.0-bath multifamily listed at $45k.
- At list price, monthly cash flow is $9k ($107k/yr) — positive.
- The deal already cash-flows at list — no discount required.
- Meets the 1% rule at list price ($12k rent vs $45k).
- It's been on market 70 days — a 6% lower offer ($42k) is reasonable based on typical stale-listing flexibility.
- Recommended offer: $42k (6.0% below list) — sets the bar for market timing.
- In year one you build about $2k of equity ($311 loan paydown + $1k appreciation (2.7% local appreciation)).
- Location reads 75/100 on livability (#239 in OH, #3,844 nationally) — a middle-class / working-renter tenant base. Strengths: crime A+, cost of living A+, housing A+; Watch: employment D+, amenities F, commute F.
- Bridgeport Exempted Village (suburban): math 49% / reading 57% proficiency, ranked #429 of 656 in OH (top 65%) — acceptable for families but not a draw, mixed tenant base, ~2y average lease.
- Watch-outs: flood insurance adds $56/mo; built in 1880 — expect roof / HVAC / electrical / plumbing capex.
- Market conditions: 40 active listings in the ZIP; 4 units permitted in Belmont County in 2024 (0 in 5+ unit buildings).
- Belmont County population projected at -15% by 2050 — secular population decline; favor cash flow + early exit over multi-decade hold.
- 2 sale attempts; this cycle's ask has dropped $10k (18%) from the opening price — seller is motivated, your offer sets the floor, not the list.
- At projected returns (2.7% appreciation + 3.0% rent growth), your $13k cash investment doubles in ~1 year — after that, you're playing with house money.
- Climate carrying-cost: severe flood risk — expect insurance premiums to compound above CPI over the hold.
- At $11,720/mo this rent would consume 272% of the median local household income ($52k/yr) — very limited rent-growth headroom before tenants either downsize or default.
Questions for listing agent
- It's been on market 70 days. Have you received any prior offers? Is the seller open to a 6% concession, seller financing, or rate buy-down credit?
- Built in 1880 — when were the roof, HVAC, electrical panel, plumbing, and water heater last replaced?
- What's the actual annual flood-insurance premium (NFIP or private), and is the property in a SFHA with mandatory coverage?
- Why hasn't it sold? Are there any deal-killer items the seller is aware of (foundation, flood, title, zoning, code violations)?
- Is there a deadline driving the sale (1031 exchange, divorce, estate, relocation)? That informs how much negotiation room exists.
- What's the average days-on-market for RENTAL listings here right now (not sales)? A rising rental-DOM trend means longer vacancies and softer asking-rent achievability than the comps imply.
- What's the recent tenant-quality profile in this submarket — average credit score on applications, eviction rate, late-payment / NSF rate, and stable-employment percentage? A property-management company in the area should have these aggregated.
- How much new apartment / multifamily construction is in the pipeline within 1–3 miles? Heavy new supply (>2% of stock underway) typically softens rents 12–24 months out; light construction supports rent growth.
CashFlowRE · CFR-DCV7H91YR08ETF
· Data 1 day ago
cashflowre.app · 2026-05-29