 Multi-family
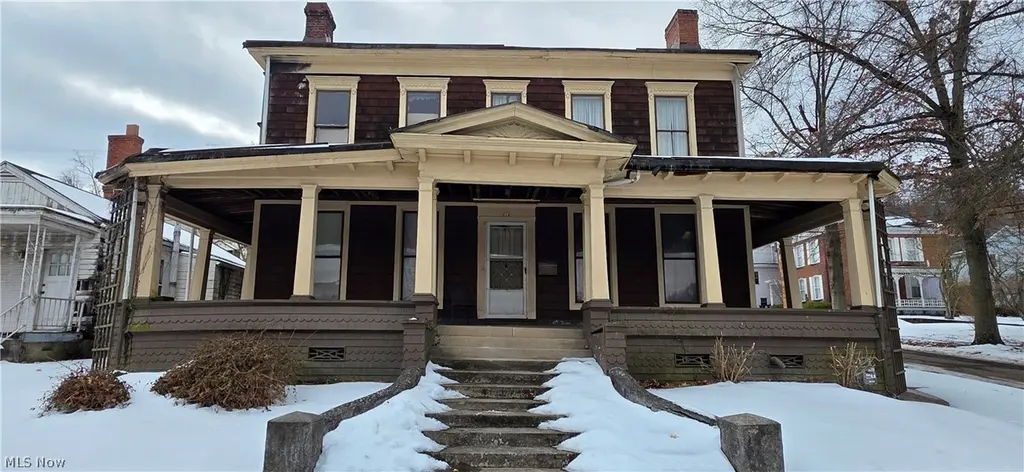
219 Whitely St · Bridgeport, OH
Flood risk 8/10 · Major
- FEMA flood zone
- X (unshaded)
- Chance of flooding over 30 yrs
- 0.78%
- Est. flood insurance / yr
- $473 – $860
Fire risk 1/10 · Minimal
- Est. fire insurance / yr
- $713 – $1,323
Heat risk 4/10 · Minor
- Hot days now (above 98°F)
- 8 days/yr
- Hot days in 30 yrs
- 21 days/yr
Wind risk 1/10 · Minimal
- Chance of severe wind over 30 yrs
- —
Air-quality risk 2/10 · Minimal
- Unhealthy air days now
- 1 days/yr
- Unhealthy air days in 30 yrs
- 2 days/yr
Risk factors via First Street. Map © Google.
Why this score? — see what drove the C grade
The composite is a weighted blend of 9 inputs, each scored 0–100. Each bar is that input's sub-score; the figure is the points it added to the 100-point composite (weight × sub-score).
- Cash flow +15.0/30.0
- ARV discount +15.0/15.0
- Appreciation +6.4/10.0
- 1% rule +5.0/10.0
- DSCR +5.0/10.0
- Schools +4.4/10.0
- Livability +3.8/5.0
- Rent growth +2.5/5.0
- Condition / age +2.5/5.0
$45,000
🖨 Deal sheet 📄 Offer letter ✓ Due diligence
Multi-family units
County records classify this as Multi-Family (2-4 Unit). Listing-text estimate: 1 unit. estimate disagrees with records
Listing remarks MLS
Step inside this remarkable home, built in 1880 and boasting over 4,000 square feet! The craftsmanship and charm are a must see. Beautiful hardwood floors, stunning stair rails, pocket doors, and wood beam ceilings await around nearly every turn. The current owner has taken great care to preserve the property, while updating electrical, plumbing, and much more. This home is waiting for its new owner to complete the restoration.
Key facts
- 5,000 sq ft lot
- Garage
- Built 1880
Neighborhood map
What this means for you Summary
Snapshot
- This is a 4-bed/2.0-bath multifamily listed at $45k.
Deal economics
- At list price, monthly cash flow is $9k ($107k/yr) — positive.
- The deal already cash-flows at list — no discount required.
- Meets the 1% rule at list price ($12k rent vs $45k).
- Recommended offer: $42k (6.0% below list) — sets the bar for market timing.
Location & tenants
- Location reads 75/100 on livability (#239 in OH, #3,844 nationally) — a middle-class / working-renter tenant base. Strengths: crime A+, cost of living A+, housing A+; Watch: employment D+, amenities F, commute F.
- Bridgeport Exempted Village (suburban): math 49% / reading 57% proficiency, ranked #429 of 656 in OH (top 65%) — acceptable for families but not a draw, mixed tenant base, ~2y average lease.
- Market conditions: 40 active listings in the ZIP; 4 units permitted in Belmont County in 2024 (0 in 5+ unit buildings).
- At $11,720/mo this rent would consume 272% of the median local household income ($52k/yr) — very limited rent-growth headroom before tenants either downsize or default.
Forward outlook
- In year one you build about $2k of equity ($311 loan paydown + $1k appreciation (2.7% local appreciation)).
- Belmont County population projected at -15% by 2050 — secular population decline; favor cash flow + early exit over multi-decade hold.
- At projected returns (2.7% appreciation + 3.0% rent growth), your $13k cash investment doubles in ~1 year — after that, you're playing with house money.
Negotiation context
- It's been on market 70 days — a 6% lower offer ($42k) is reasonable based on typical stale-listing flexibility.
- 2 sale attempts; this cycle's ask has dropped $10k (18%) from the opening price — seller is motivated, your offer sets the floor, not the list.
Risks & watch-outs
- Watch-outs: flood insurance adds $56/mo; built in 1880 — expect roof / HVAC / electrical / plumbing capex.
- Climate carrying-cost: severe flood risk — expect insurance premiums to compound above CPI over the hold.
Questions for the listing agent
- It's been on market 70 days. Have you received any prior offers? Is the seller open to a 6% concession, seller financing, or rate buy-down credit?
- Built in 1880 — when were the roof, HVAC, electrical panel, plumbing, and water heater last replaced?
- What's the actual annual flood-insurance premium (NFIP or private), and is the property in a SFHA with mandatory coverage?
- Why hasn't it sold? Are there any deal-killer items the seller is aware of (foundation, flood, title, zoning, code violations)?
- Is there a deadline driving the sale (1031 exchange, divorce, estate, relocation)? That informs how much negotiation room exists.
- What's the average days-on-market for RENTAL listings here right now (not sales)? A rising rental-DOM trend means longer vacancies and softer asking-rent achievability than the comps imply.
- What's the recent tenant-quality profile in this submarket — average credit score on applications, eviction rate, late-payment / NSF rate, and stable-employment percentage? A property-management company in the area should have these aggregated.
- How much new apartment / multifamily construction is in the pipeline within 1–3 miles? Heavy new supply (>2% of stock underway) typically softens rents 12–24 months out; light construction supports rent growth.
Investment metrics
- 1% rule
- 26.04% ✓
- Cap rate
- 244.90%
- Cash-on-cash
- 852.17%
- DSCR
- 38.92
- GRM
- 0.3
CMA / ARV
- ARV (median comp)
- $88,829
- List price
- $45,000
- Delta
- -49.34%
- Verdict
- UNDERPRICED
- Comps
- 20 within 1.0 mi
Show comp detail 1 sale within ~0.75 mi
| Address | Dist | Beds/Ba | Sqft | Sold | Price | $/sf | Match |
|---|---|---|---|---|---|---|---|
| 98 Iowa St | 0.68mi | 4/2.0 | 2,771 (-12%) | 3mo | $39,900 | $14 | 45 |
Match score weights: distance 35% · size 25% · config 20% · recency 20%. Top-matched comps best support the ARV.
Projected returns pro-forma
2.71% appreciation · 3.0% rent growth · sell at horizon
- IRR
- —
- Equity multiple
- 46.34×
- Total profit
- $571,308
- Equity at exit
- $19,514
- IRR
- —
- Equity multiple
- 99.51×
- Total profit
- $1,241,228
- Equity at exit
- $29,525
Cash invested: $12,600 (down + closing). Projections, not guarantees.
Landlord ↔ Tenant lean methodology
- Overall (STATE)
- 73 Landlord-Friendly
- State Ohio
- 73 Landlord-Friendly · R+6
- County
- — inherits STATE
- City
- — inherits STATE
ZIP-level market 43912
- Home prices YoY
- 1.7%
- Active inventory
- 40
- Price-to-rent
- 1.0×
Monthly cashflow live
- Estimated rent
- $11,720 medium interval (Pro) →
- Mortgage (P&I)
- −$236
- Tax est. 1.5%
- −$56 /mo · $675/yr
- Insurance
- −$19
- Flood insurance flood zone
- −$56 /mo · $666/yr
- HOA
- −$0
- Vacancy / Maint / Mgmt
- −$2,461
- Net cashflow
- $8,892
Break-even live
3-unit breakdown (identical units grouped — click to expand)
| Units | Beds | Baths | Est. rent |
|---|---|---|---|
| 3× units | 2 | 1 | $11,721 |
| #1 | 2 | 1 | $3,907 |
| #2 | 2 | 1 | $3,907 |
| #3 | 2 | 1 | $3,907 |
| Total (3 units) | $11,720 | ||
UW: 25.0% down · 7.5% · 30yr · 1.5% tax · 5.0% vac · 8.0% maint · 8.0% mgmt
Financing live
Cash to close
- Down payment
- $11,250
- Closing costs
- $1,350
- Reserves months
- —
- Total cash needed
- —
Loan-product check · same deal, 3 products live
Conventional
25% down · 7.5% · 30yr
- Down + closing
- —
- Monthly P&I
- —
- Monthly cashflow
- —
- DSCR
- —
- Eligible?
- —
Personal DTI + credit; lowest rate.
DSCR
20% down · 8.5% · 30yr
- Down + closing
- —
- Monthly P&I
- —
- Monthly cashflow
- —
- DSCR
- —
- Eligible?
- —
No personal income docs; deal must DSCR.
Hard money
10% down · 12.0% · 12mo
- Down + closing
- —
- Monthly P&I
- —
- Monthly cashflow
- —
- DSCR
- —
- Eligible?
- —
Short-term bridge; refi at stabilization.
Listing history 18 events
-
2026-06-19days on market $45,000 Active 70 DOM
-
2026-06-18days on market $45,000 Active 69 DOM
-
2026-06-17days on market $45,000 Active 68 DOM
-
2026-06-16days on market $45,000 Active 67 DOM
-
2026-06-15days on market $45,000 Active 66 DOM
-
2026-06-14days on market $45,000 Active 64 DOM
-
2026-06-12days on market $45,000 Active 63 DOM
-
2026-06-09days on market $45,000 Active 60 DOM
-
2026-06-08days on market $45,000 Active 59 DOM
-
2026-06-07pricedays on market $45,000 Active 58 DOM
-
2026-06-03days on market $55,000 Active 54 DOM
-
2026-06-02days on market $55,000 Active 53 DOM
-
2026-06-01days on market $55,000 Active 52 DOM
-
2026-05-31days on market $55,000 Active 51 DOM
-
2026-05-30days on market $55,000 Active 50 DOM
-
2026-04-17status Active 431-char remark
Show marketing remark (431 chars)
Step inside this remarkable home, built in 1880 and boasting over 4,000 square feet! The craftsmanship and charm are a must see. Beautiful hardwood floors, stunning stair rails, pocket doors, and wood beam ceilings await around nearly every turn. The current owner has taken great care to preserve the property, while updating electrical, plumbing, and much more. This home is waiting for its new owner to complete the restoration.
-
2026-02-22status Pending 431-char remark
Show marketing remark (431 chars)
Step inside this remarkable home, built in 1880 and boasting over 4,000 square feet! The craftsmanship and charm are a must see. Beautiful hardwood floors, stunning stair rails, pocket doors, and wood beam ceilings await around nearly every turn. The current owner has taken great care to preserve the property, while updating electrical, plumbing, and much more. This home is waiting for its new owner to complete the restoration.
-
2026-02-15$55,000 Active 431-char remark
Show marketing remark (431 chars)
Step inside this remarkable home, built in 1880 and boasting over 4,000 square feet! The craftsmanship and charm are a must see. Beautiful hardwood floors, stunning stair rails, pocket doors, and wood beam ceilings await around nearly every turn. The current owner has taken great care to preserve the property, while updating electrical, plumbing, and much more. This home is waiting for its new owner to complete the restoration.
ⓘ Source: listings_history table (triggers on properties + properties_extension) + one-shot
backfill from property_details.listing_events for pre-trigger history.
Climate risk First Street
- Flood 8/10 Severe FEMA zone X (unshaded) · 78% chance over 30 yrs
- Wildfire 1/10 Low
- Heat 4/10 Moderate 8 d/yr ≥98°F today · 21 d/yr by 30 yrs out
- Wind 1/10 Low
- Air quality 2/10 Low 1 unhealthy d/yr today · 2 by 30 yrs out
Nearby sold comps map
Loading sold comps map…
Walkable amenities ~0.75 mi
Loading nearby amenities…
Taxation est. · year 1
- Rental income
- $140,640
- − Mortgage interest
- −$2,521
- − Property taxes
- −$675
- − Insurance
- −$891
- − Repairs & maintenance
- −$11,251
- − Management
- −$11,251
- − Depreciation
- −$1,309
- Taxable income
- $112,741
- Est. tax owed @ 24.0%
- −$27,058
- After-tax cash flow
- $79,649/yr
For passive investors: Depreciation is non-cash, so a rental often shows a tax loss while cash-flowing — sheltering income. Rental losses are passive: they offset passive income freely, and up to $25,000/yr can offset ordinary (W-2) income if you actively participate and your MAGI is under $100k (phasing out to $0 by $150k); unused losses carry forward. On sale, claimed depreciation is recaptured at up to 25%, and gains may owe capital-gains tax (a 1031 exchange can defer both). Figures are a year-1 estimate at your 24.0% rate — not tax advice; consult a CPA.
Schools (NCES district)
- District
- Bridgeport Exempted Village
- NCES district ID
- 3904523
- Math proficiency
- 49% ▼ -16.00%
- Reading proficiency
- 57% ▼ -8.00%
- Median HH income
- $31,819
- Composite
- 43.51/100
- National rank
- #2992
- State rank
- #429 of 656 in OH
Livability — Bridgeport
- Score
- 75/100
- State rank
- #239
- US rank
- #3844
Category grades
Schools grade is shown separately in the Schools card above.
Census & demographics
- Census place
- Bridgeport, OH
- County
- Belmont · 63,139 people
- Metro
- Wheeling, WV-OH
- Population (ZIP)
- 5,852
- Household income
- $51,753
- Rent vs Own
- Severe rent burden
- 8.1
Population outlook (Belmont County) Hauer SSP2
- Today (2025)
- 66,568 people
- By 2030
- 64,818 · -2.6%
- By 2040
- 60,702 · -8.8%
- By 2050
- 56,427 · -15.2%
- By 2075
- 46,222 · -30.6%
- By 2100
- 34,611 · -48.0%
Race, ethnicity, and origin ACS 2023
- Neighborhood character
- Predominantly White (88%)
- Race & ethnicity
- White 88% Two or more races 6% Black 4% Hispanic / Latino 2%
- Common ancestry
- Romanian 8% Slovak 2% Lithuanian 2%
- Foreign-born
- 1% · Canada
- Languages at home
- 98% English-only · Spanish 1% German/W. Germanic 1%
Political lean MEDSL · Belmont
- 2024 margin
- Solid R (+47.3) · D 26.0% · R 73.3%
- 2008→2024 swing
- -50.0pp toward R · 2008: 2.7pp · 2024: -47.3pp
- All cycles
- 2024: R+47.3 2020: R+43.6 2016: R+39.5 2012: R+8.4 2008: D+2.7
Not yet ingested
- Civics
- —
Market trends
- HPI YoY
- ▲ 2.71%
- Current HPI
- 159.7811
- Rent YoY
- —
- Metro
- —
- State GDP YoY
- ▲ 1.98%
- F500 in state
- 48
Industry mix (Fortune 500 HQ in OH)
| Industry | F500 HQs | Revenue |
|---|---|---|
| Insurance | 3 | $145B |
|
||
| Industrial Machinery | 3 | $49B |
|
||
| Financial Services | 3 | $24B |
|
||
| Consumer Goods | 2 | $93B |
|
||
| Aerospace / Defense | 2 | $47B |
|
||
| Utilities | 2 | $33B |
|
||
Price history
3 events — show timeline
- 2026-04-17 Relisted — MLSNOW
- 2026-02-22 Pending — MLSNOW
- 2026-02-15 Listed $55,000 MLSNOW
Property tax history
+17.0%/yrLatest (2025): $2,370 · +2.3% YoY. Source: county tax records.
Cash-flow waterfall
monthlySold comps — $/sqft
last 12 mo · ≤1 miLoading sold comps…