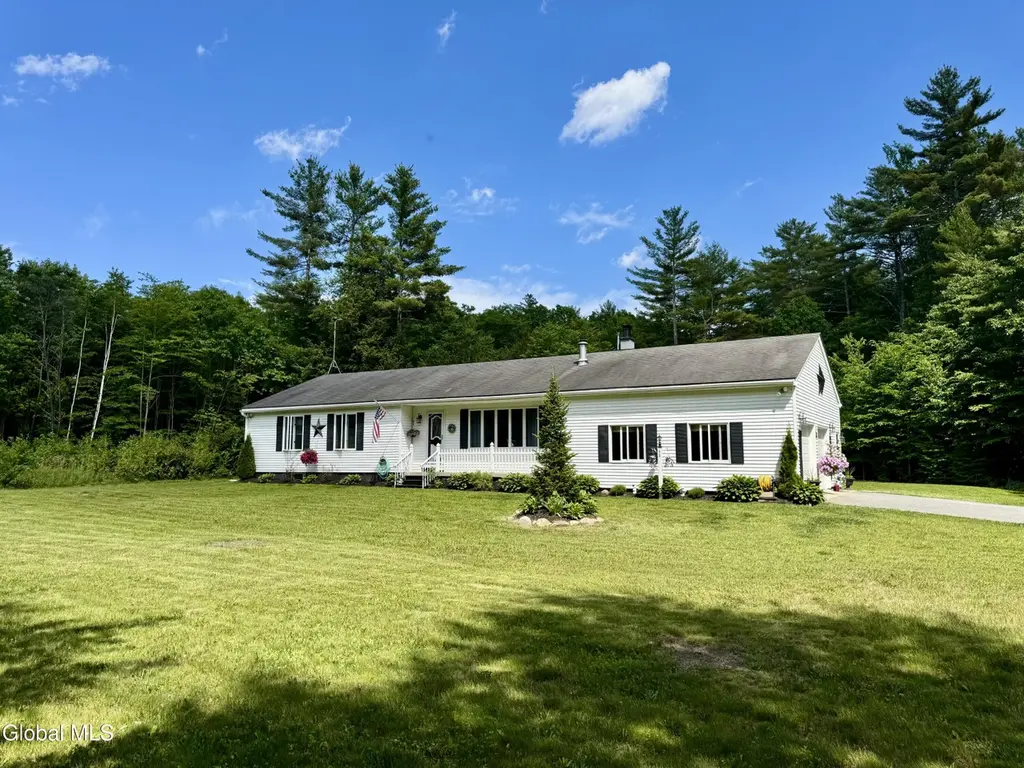
59 North Dr
Corinth, NY 12846
$424,900C-
3 bd · 2.0 ba ·
1,572 sqft ·
Built 1985
· SingleFamily
· Active
· 7 DOM
Cashflow @ list (25.0% down · 7.5%)
Estimated rent
$3,454/mo
Mortgage (P&I)
−$2,228
Tax + insurance
−$520
HOA
−$0
Vac / Maint / Mgmt
−$725
Net cashflow
$-20/mo
Annual
$-241/yr
Cap rate
6.24%
Cash-on-cash
-0.20%
DSCR
0.99
1% rule
0.81%
Cash to close
$118,972
Investor read
- This is a 3-bed/2.0-bath single-family listed at $425k.
- At list price, monthly cash flow is $-20 ($-241/yr) — negative.
- To cash-flow at today's rent, offer at most $421k (0.8% below list).
- To meet the 1% rule (rent ≥ 1% of price), the offer needs to be $345k (18.7% below list).
- Only 7 days on market — expect competitive offers; lowballing is unlikely to land.
- Recommended offer: $345k (18.7% below list) — sets the bar for 1% rule.
- In year one you build about $45k of equity ($3k loan paydown + $42k appreciation (10.0% local appreciation)).
- Location reads 68/100 on livability (#514 in NY) — a middle-class / working-renter tenant base. Strengths: housing A+, crime A-, cost of living B+; Watch: employment C-, amenities F, commute F.
- Hadley-Luzerne Central School District (rural): math 41% / reading 57% proficiency, ranked #396 of 590 in NY (top 67%) — families likely to look elsewhere, expect single-tenant / working-renter base with shorter leases.
- Zoned schools: Hadley-Luzerne Junior-Senior High School (math 62% / reading 67%, grade B-, #776 of 1,100 statewide, top 73%, 304 students, 54% FRL).
- Zoned-school proficiency averages 64% at this address vs 49% district-wide (+16 pts) — the actual schools serving this property are materially stronger than the Hadley-Luzerne Central School District average implies; a family-tenant draw the district grade alone would hide.
- Market conditions: 39 active listings in the ZIP; 180 units permitted in Warren County in 2024 (40 in 5+ unit buildings).
- Warren County population projected at -19% by 2050 — secular population decline; favor cash flow + early exit over multi-decade hold.
- 2 sale attempts since 8y ago with the ask held roughly flat each time — persistent listings suggest the price (not the market) is what's stuck; bring a comps-based counter.
- Current owner paid $170k; list at $425k implies a 150% gain — meaningful room to come down on a strong offer.
- At projected returns (10.0% appreciation + 3.0% rent growth), your $119k cash investment doubles in ~3 years — after that, you're playing with house money.
- By year 2, paydown + projected appreciation supports a ~$73k cash-out refi (75% LTV) — recoverable capital for the next deal without selling this one.
- Cap rate 6.2% vs local median 3.2% in Corinth — top-decile yield for the area; either an underpriced asset or a hidden risk that comps aren't pricing in. Stress-test before assuming the spread holds.
Questions for listing agent
- What do current leases actually rent for vs. the listed asking? Can we see a recent rent roll and the last 12 months of T-12 income?
- Is there a deadline driving the sale (1031 exchange, divorce, estate, relocation)? That informs how much negotiation room exists.
- What's the average days-on-market for RENTAL listings here right now (not sales)? A rising rental-DOM trend means longer vacancies and softer asking-rent achievability than the comps imply.
- What's the recent tenant-quality profile in this submarket — average credit score on applications, eviction rate, late-payment / NSF rate, and stable-employment percentage? A property-management company in the area should have these aggregated.
- How much new for-sale + rental construction is in the pipeline within 1–3 miles? Heavy new supply typically softens prices + rents 12–24 months out; constrained supply supports both.
CashFlowRE · CFR-DDF7JP19HZFPYP
· Data 2 days ago
cashflowre.app · 2026-05-29