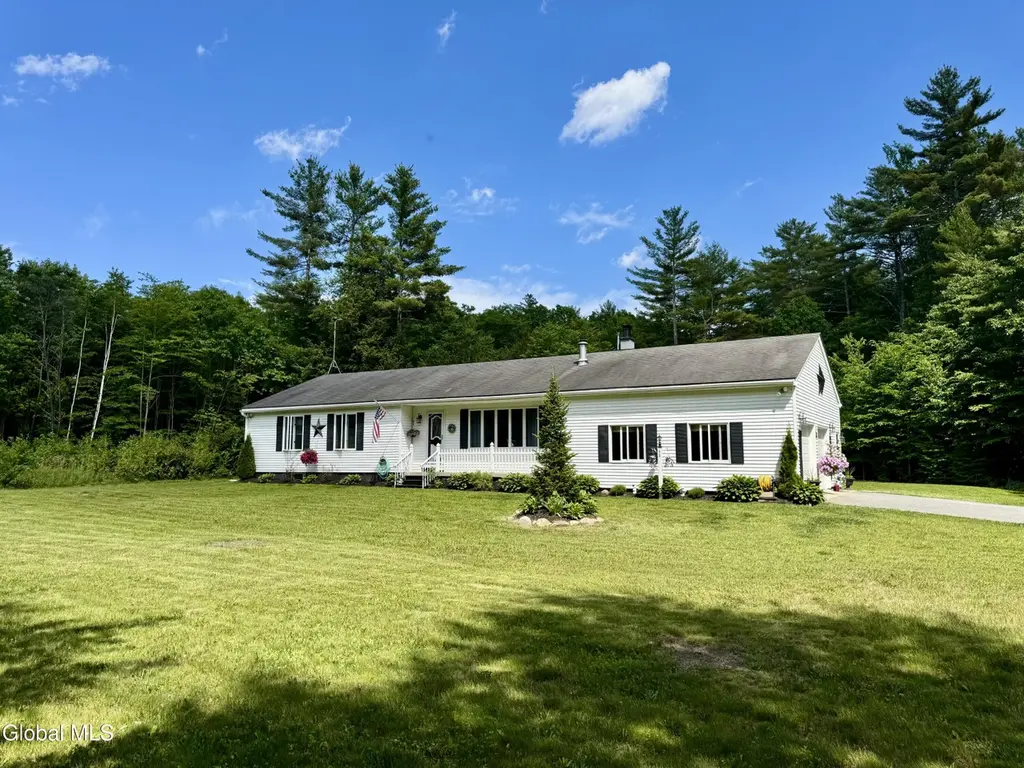
59 North Dr · Corinth, NY
Flood risk 1/10 · Minimal
- FEMA flood zone
- X
- Chance of flooding over 30 yrs
- 0.0%
- Est. flood insurance / yr
- $473 – $860
Fire risk 2/10 · Minimal
- Est. fire insurance / yr
- $691 – $1,283
Heat risk 2/10 · Minimal
- Hot days now (above 94°F)
- 7 days/yr
- Hot days in 30 yrs
- 16 days/yr
Wind risk 2/10 · Minimal
- Chance of severe wind over 30 yrs
- 3.0%
Air-quality risk 1/10 · Minimal
- Unhealthy air days now
- 0 days/yr
- Unhealthy air days in 30 yrs
- 0 days/yr
Risk factors via First Street. Map © Google.
Why this score? — see what drove the C- grade
The composite is a weighted blend of 9 inputs, each scored 0–100. Each bar is that input's sub-score; the figure is the points it added to the 100-point composite (weight × sub-score).
- Cash flow +13.0/30.0
- Appreciation +10.0/10.0
- ARV discount +7.5/15.0
- Schools +4.2/10.0
- DSCR +3.9/10.0
- Livability +3.4/5.0
- 1% rule +3.1/10.0
- Rent growth +2.5/5.0
- Condition / age +2.5/5.0
$424,900
🖨 Deal sheet 📄 Offer letter ✓ Due diligence
Listing remarks MLS
Enjoy the Adirondacks at its finest. This well built one owner ranch home on 11.62 acres is a must see. Used as a summer home for kids and grandkids. Stroll on down to the public beach and enjoy the summers! 10 minute drive to West Mountain Ski Resort! 3 bedrooms with 2 full bathes. Large basement. Needs some updating. Very Good Condition
Key facts
- 11.62 acres
- Large back deck
- Ranch home
Tags
Property features AI
Exterior
- Parking: 2-car garage with garage door opener; Driveway; 10 total parking spaces
- Utilities: Public water; Septic tank sewer
- Home design: Single family residence; Entry on the first level
- Construction: Vinyl siding; Shingle/asphalt roof
- Exterior features: Deck; Wooded lot
Interior
- Kitchen: Dishwasher; Microwave; Range; Refrigerator
- Bedrooms: Primary bedroom on the first level; Additional bedrooms on the first level
- Flooring: Hardwood; Laminate
- Bathrooms: 2 full bathrooms on the first level
- Heating & cooling: Forced air heating; Propane heating; Wood heating
- Interior features: 10 total rooms; Full basement; Living room with fireplace
- Laundry & utility: Laundry room; Washer/Dryer included
Neighborhood map
What this means for you Summary
Snapshot
- This is a 3-bed/2.0-bath single-family listed at $425k.
Deal economics
- At list price, monthly cash flow is $-20 ($-241/yr) — negative.
- To cash-flow at today's rent, offer at most $421k (0.8% below list).
- To meet the 1% rule (rent ≥ 1% of price), the offer needs to be $345k (18.7% below list).
- Recommended offer: $345k (18.7% below list) — sets the bar for 1% rule.
- Cap rate 6.2% vs local median 3.2% in Corinth — top-decile yield for the area; either an underpriced asset or a hidden risk that comps aren't pricing in. Stress-test before assuming the spread holds.
Location & tenants
- Location reads 68/100 on livability (#514 in NY) — a middle-class / working-renter tenant base. Strengths: housing A+, crime A-, cost of living B+; Watch: employment C-, amenities F, commute F.
- Hadley-Luzerne Central School District (rural): math 41% / reading 57% proficiency, ranked #396 of 590 in NY (top 67%) — families likely to look elsewhere, expect single-tenant / working-renter base with shorter leases.
- Zoned schools: Hadley-Luzerne Junior-Senior High School (math 62% / reading 67%, grade B-, #776 of 1,100 statewide, top 73%, 304 students, 54% FRL).
- Zoned-school proficiency averages 64% at this address vs 49% district-wide (+16 pts) — the actual schools serving this property are materially stronger than the Hadley-Luzerne Central School District average implies; a family-tenant draw the district grade alone would hide.
- Market conditions: 39 active listings in the ZIP; 180 units permitted in Warren County in 2024 (40 in 5+ unit buildings).
Forward outlook
- In year one you build about $45k of equity ($3k loan paydown + $42k appreciation (10.0% local appreciation)).
- Warren County population projected at -19% by 2050 — secular population decline; favor cash flow + early exit over multi-decade hold.
- At projected returns (10.0% appreciation + 3.0% rent growth), your $119k cash investment doubles in ~3 years — after that, you're playing with house money.
- By year 2, paydown + projected appreciation supports a ~$73k cash-out refi (75% LTV) — recoverable capital for the next deal without selling this one.
Negotiation context
- Only 7 days on market — expect competitive offers; lowballing is unlikely to land.
- 2 sale attempts since 8y ago with the ask held roughly flat each time — persistent listings suggest the price (not the market) is what's stuck; bring a comps-based counter.
- Current owner paid $170k; list at $425k implies a 150% gain — meaningful room to come down on a strong offer.
Questions for the listing agent
- What do current leases actually rent for vs. the listed asking? Can we see a recent rent roll and the last 12 months of T-12 income?
- Is there a deadline driving the sale (1031 exchange, divorce, estate, relocation)? That informs how much negotiation room exists.
- What's the average days-on-market for RENTAL listings here right now (not sales)? A rising rental-DOM trend means longer vacancies and softer asking-rent achievability than the comps imply.
- What's the recent tenant-quality profile in this submarket — average credit score on applications, eviction rate, late-payment / NSF rate, and stable-employment percentage? A property-management company in the area should have these aggregated.
- How much new for-sale + rental construction is in the pipeline within 1–3 miles? Heavy new supply typically softens prices + rents 12–24 months out; constrained supply supports both.
Investment metrics
- 1% rule
- 0.81% ✗
- Cap rate
- 6.24%
- Cash-on-cash
- -0.20%
- DSCR
- 0.99
- GRM
- 10.3
CMA / ARV
- ARV (on-the-fly)
- $210,648
- Comps found
- 3
Show comp detail 3 sales within ~0.75 mi
| Address | Dist | Beds/Ba | Sqft | Sold | Price | $/sf | Match |
|---|---|---|---|---|---|---|---|
| 122 Harris Ave | 0.22mi | 3/2.5 | 1,568 (-0%) | 12mo | $210,000 | $134 | 77 |
| 2229 Call St | 0.13mi | 3/1.5 | 1,530 (-3%) | 17mo | $255,900 | $167 | 73 |
| 152 E River Dr | 0.40mi | 4/1.5 (+1) | 1,488 (-5%) | 22mo | $198,900 | $134 | 47 |
Match score weights: distance 35% · size 25% · config 20% · recency 20%. Top-matched comps best support the ARV.
Projected returns pro-forma
10.0% appreciation · 3.0% rent growth · sell at horizon
- IRR
- 24.1%
- Equity multiple
- 2.93×
- Total profit
- $230,070
- Equity at exit
- $382,784
- IRR
- 21.4%
- Equity multiple
- 6.70×
- Total profit
- $678,397
- Equity at exit
- $825,487
Cash invested: $118,972 (down + closing). Projections, not guarantees.
Landlord ↔ Tenant lean methodology
- Overall (STATE)
- 15 Strongly Tenant-Friendly
- State New York
- 15 Strongly Tenant-Friendly · D+10
- County
- — inherits STATE
- City
- — inherits STATE
ZIP-level market 12846
- Home prices YoY
- 16.1%
- Active inventory
- 39
- Price-to-rent
- 10.3×
Monthly cashflow live
- Estimated rent
- $3,454 medium interval (Pro) →
- Mortgage (P&I)
- −$2,228
- Tax from tax record
- −$343 /mo · $4,118/yr
- Insurance
- −$177
- HOA
- −$0
- Vacancy / Maint / Mgmt
- −$725
- Net cashflow
- $-20
Break-even live
UW: 25.0% down · 7.5% · 30yr · 1.5% tax · 5.0% vac · 8.0% maint · 8.0% mgmt
Financing live
Cash to close
- Down payment
- $106,225
- Closing costs
- $12,747
- Reserves months
- —
- Total cash needed
- —
Loan-product check · same deal, 3 products live
Conventional
25% down · 7.5% · 30yr
- Down + closing
- —
- Monthly P&I
- —
- Monthly cashflow
- —
- DSCR
- —
- Eligible?
- —
Personal DTI + credit; lowest rate.
DSCR
20% down · 8.5% · 30yr
- Down + closing
- —
- Monthly P&I
- —
- Monthly cashflow
- —
- DSCR
- —
- Eligible?
- —
No personal income docs; deal must DSCR.
Hard money
10% down · 12.0% · 12mo
- Down + closing
- —
- Monthly P&I
- —
- Monthly cashflow
- —
- DSCR
- —
- Eligible?
- —
Short-term bridge; refi at stabilization.
Listing history 7 events
-
2026-06-18days on market $424,900 Active 7 DOM
-
2026-06-17days on market $424,900 Active 6 DOM
-
2026-06-16days on market $424,900 Active 5 DOM
-
2026-06-15days on market $424,900 Active 4 DOM
-
2026-06-13days on market $424,900 Active 2 DOM
-
2026-06-12remarks 699-char remark
-
2026-06-12$424,900 Active 1 DOM
ⓘ Source: listings_history table (triggers on properties + properties_extension) + one-shot
backfill from property_details.listing_events for pre-trigger history.
Tax reassessment forecast NY · Partial reset (capped growth)
- Current annual tax
- $4,118 · $343/mo
- Projected year-2 tax
- $5,650 · $471/mo
- Expected delta
- +$1,531/yr (+$128/mo · 37.2%)
ⓘ Screening estimate from a state-policy table — verify with the county assessor before closing.
Climate risk First Street
- Flood 1/10 Low FEMA zone X · 0% chance over 30 yrs
- Wildfire 2/10 Low
- Heat 2/10 Low 7 d/yr ≥94°F today · 16 d/yr by 30 yrs out
- Wind 2/10 Low 3% chance of damaging wind over 30 yrs
- Air quality 1/10 Low 0 unhealthy d/yr today · 0 by 30 yrs out
Nearby sold comps map
Loading sold comps map…
Walkable amenities ~0.75 mi
Loading nearby amenities…
Taxation est. · year 1
- Rental income
- $41,444
- − Mortgage interest
- −$23,801
- − Property taxes
- −$4,118
- − Insurance
- −$2,124
- − Repairs & maintenance
- −$3,316
- − Management
- −$3,316
- − Depreciation
- −$12,361
- Taxable loss
- −$7,592
- Est. tax savings @ 24.0%
- +$1,822
- After-tax cash flow
- $1,581/yr
For passive investors: Depreciation is non-cash, so a rental often shows a tax loss while cash-flowing — sheltering income. Rental losses are passive: they offset passive income freely, and up to $25,000/yr can offset ordinary (W-2) income if you actively participate and your MAGI is under $100k (phasing out to $0 by $150k); unused losses carry forward. On sale, claimed depreciation is recaptured at up to 25%, and gains may owe capital-gains tax (a 1031 exchange can defer both). Figures are a year-1 estimate at your 24.0% rate — not tax advice; consult a CPA.
Schools (NCES district)
- District
- Hadley-Luzerne Central School District
- NCES district ID
- 3613110
- Math proficiency
- 41% ▼ -15.00%
- Reading proficiency
- 57% ▲ 2.00%
- Median HH income
- $52,974
- Composite
- 42.18/100
- National rank
- #3292
- State rank
- #396 of 590 in NY
Livability — Corinth
- Score
- 68/100
- State rank
- #514
- US rank
- #9140
Category grades
Schools grade is shown separately in the Schools card above.
Census & demographics
- Population (ZIP)
- 3,007
Population outlook (Warren County) Hauer SSP2
- Today (2025)
- 62,372 people
- By 2030
- 60,491 · -3.0%
- By 2040
- 55,616 · -10.8%
- By 2050
- 50,437 · -19.1%
- By 2075
- 40,843 · -34.5%
- By 2100
- 31,159 · -50.0%
Race, ethnicity, and origin ACS 2023
- Neighborhood character
- Predominantly White (98%)
- Race & ethnicity
- White 98%
- Common ancestry
- Romanian 10% Lithuanian 10% German 5%
- Foreign-born
- 1% · Canada
Political lean MEDSL · Warren
- 2024 margin
- Toss-up / Even · D 47.9% · R 52.1%
- 2008→2024 swing
- -6.9pp toward R · 2008: 2.6pp · 2024: -4.2pp
- All cycles
- 2024: R+4.2 2020: R+0.2 2016: R+10.6 2012: D+2.1 2008: D+2.6
Not yet ingested
- Civics
- —
Market trends
- HPI YoY
- ▲ 46.73%
- Current HPI
- 336.2179
- Rent YoY
- —
- Metro
- —
- State GDP YoY
- ▲ 2.60%
- F500 in state
- 92
Industry mix (Fortune 500 HQ in NY)
| Industry | F500 HQs | Revenue |
|---|---|---|
| Financial Services | 10 | $950B |
|
||
| Consumer Goods | 9 | $162B |
|
||
| Insurance | 4 | $225B |
|
||
| Telecommunications | 2 | $144B |
|
||
| Pharmaceuticals | 2 | $112B |
|
||
| Media / Entertainment | 2 | $69B |
|
||
Price history
+137.4% since first listed4 events — show timeline
- 2026-06-11 Listed $424,900 Global MLS
- 2018-10-01 Sold (MLS) $170,000 Global MLS
- 2018-09-05 Sold (Public Records) $105,000 Public Records
- 2018-07-27 Listed $179,000 Global MLS
Property tax history
+1.3%/yrLatest (2025): $4,118 · +5.2% YoY. Source: county tax records.
Cash-flow waterfall
monthlySold comps — $/sqft
last 12 mo · ≤1 miLoading sold comps…