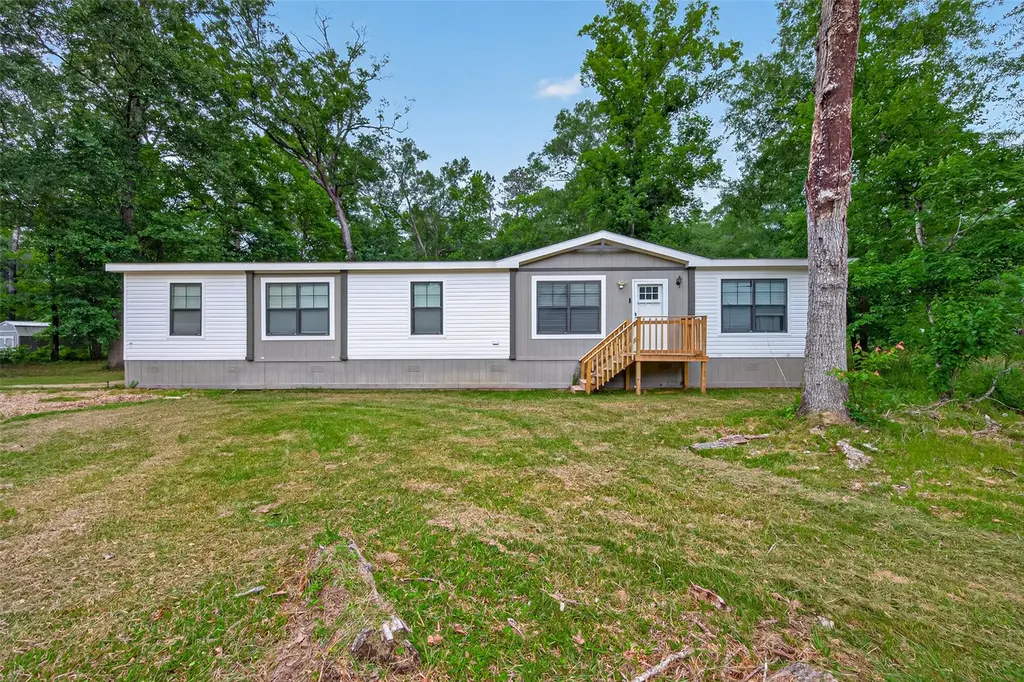
717 County Road 2218
Cleveland, TX 77327
$186,000C
4 bd · 2.0 ba ·
1,768 sqft ·
Built 2018
· Manufactured
· Pending
· 20 DOM
Cashflow @ list (25.0% down · 7.5%)
Estimated rent
$1,789/mo
Mortgage (P&I)
−$975
Tax + insurance
−$143
HOA
−$0
Vac / Maint / Mgmt
−$376
Net cashflow
$295/mo
Annual
$3,535/yr
Cap rate
8.19%
Cash-on-cash
6.79%
DSCR
1.30
1% rule
0.96%
Cash to close
$52,080
Investor read
- This is a 4-bed/2.0-bath manufactured listed at $186k.
- At list price, monthly cash flow is $295 ($4k/yr) — positive.
- The deal already cash-flows at list — no discount required.
- To meet the 1% rule (rent ≥ 1% of price), the offer needs to be $179k (3.8% below list).
- It's been on market 20 days — a 2% lower offer ($183k) is reasonable based on typical stale-listing flexibility.
- Recommended offer: $179k (3.8% below list) — sets the bar for 1% rule.
- Local home prices are declining (-3.0%/yr); year-one equity from $1k of loan paydown is wiped out by about $6k of value loss. Plan a longer hold.
- Location reads 61/100 on livability (#1,013 in TX) — a middle-class / working-renter tenant base. Strengths: cost of living A+, housing A+; Watch: crime D-, amenities F, commute F.
- Tarkington ISD (rural): math 43% / reading 38% proficiency, ranked #373 of 826 in TX (top 45%) — families likely to look elsewhere, expect single-tenant / working-renter base with shorter leases.
- Zoned schools: Tarkington Early Childhood School (math 32% / reading 42%, grade F, #1,769 of 4,322 statewide, top 44%, 193 students, 66% FRL); Tarkington Middle (math 45% / reading 32%, grade F, #704 of 1,662 statewide, top 43%, 414 students, 58% FRL); Tarkington H S (math 32% / reading 47%, grade F, #821 of 1,632 statewide, top 53%, 513 students, 48% FRL).
- Market conditions: Rents rising fast (+4.0%/yr); 1578 active listings in the ZIP; 1,321 units permitted in Liberty County in 2024 (0 in 5+ unit buildings).
- Liberty County population projected at +24% by 2050 — long-run rental-demand tailwind backs the buy-and-hold thesis.
- Climate carrying-cost: severe wind risk, 99% chance of damaging wind over 30y; moderate wildfire risk; extreme-heat days projected 7→22/yr by 2055 (HVAC capex compounding) — expect insurance premiums to compound above CPI over the hold.
- Cap rate 8.2% vs local median 4.6% in Cleveland — top-decile yield for the area; either an underpriced asset or a hidden risk that comps aren't pricing in. Stress-test before assuming the spread holds.
- This rent runs 35% of the median local income ($62k/yr) — at the standard rent-burdened threshold; future hikes will face affordability resistance.
Questions for listing agent
- Is there a deadline driving the sale (1031 exchange, divorce, estate, relocation)? That informs how much negotiation room exists.
- Schools are F-rated, which usually means shorter tenancies and higher turnover. Who's the typical renter profile here, and what's been the actual vacancy rate?
- Crime grade is D in this area — have there been break-ins, vandalism, or insurance claims at this property in the last 3 years? What carrier currently insures it and at what premium?
- What's the average days-on-market for RENTAL listings here right now (not sales)? A rising rental-DOM trend means longer vacancies and softer asking-rent achievability than the comps imply.
- What's the recent tenant-quality profile in this submarket — average credit score on applications, eviction rate, late-payment / NSF rate, and stable-employment percentage? A property-management company in the area should have these aggregated.
- How much new for-sale + rental construction is in the pipeline within 1–3 miles? Heavy new supply typically softens prices + rents 12–24 months out; constrained supply supports both.
CashFlowRE · CFR-DDYXDY57MJ5QF5
· Data 1 week ago
cashflowre.app · 2026-05-29