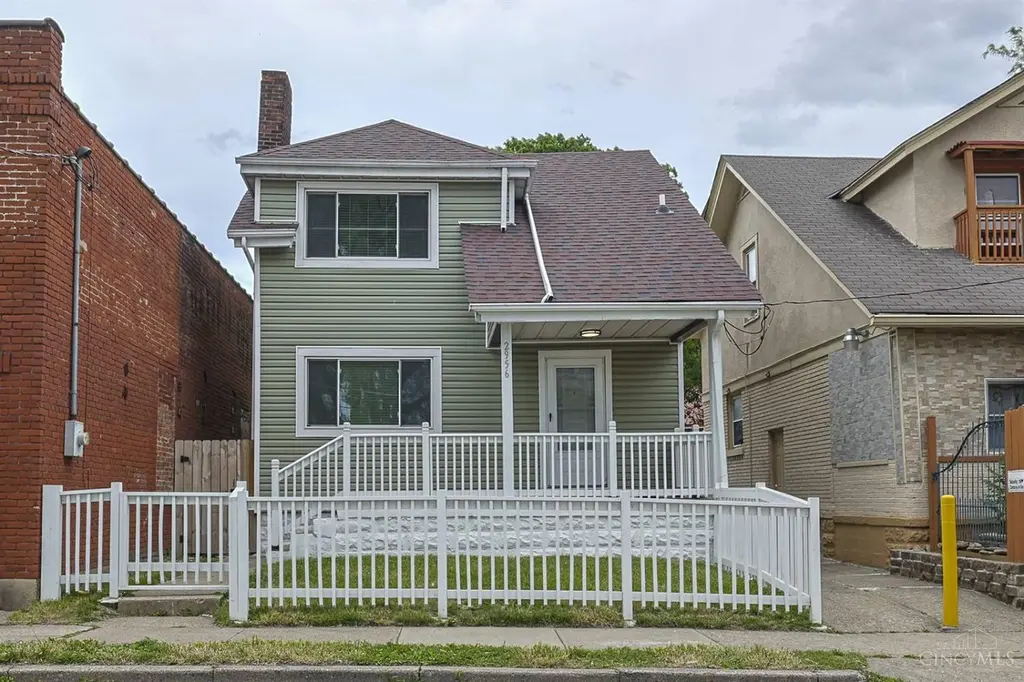
2956 Henshaw Ave
Cincinnati, OH 45225
$235,000D
3 bd · 1.0 ba ·
1,064 sqft ·
Built 1924
· SingleFamily
· Active
· 49 DOM
Cashflow @ list (25.0% down · 7.5%)
Estimated rent
$1,580/mo
Mortgage (P&I)
−$1,232
Tax + insurance
−$205
HOA
−$0
Vac / Maint / Mgmt
−$332
Net cashflow
$-189/mo
Annual
$-2,272/yr
Cap rate
5.33%
Cash-on-cash
-3.45%
DSCR
0.85
1% rule
0.67%
Cash to close
$65,800
Investor read
- This is a 3-bed/1.0-bath single-family listed at $235k.
- At list price, monthly cash flow is $-189 ($-2k/yr) — negative.
- To cash-flow at today's rent, offer at most $202k (14.2% below list).
- To meet the 1% rule (rent ≥ 1% of price), the offer needs to be $158k (32.8% below list).
- It's been on market 49 days — a 3% lower offer ($228k) is reasonable based on typical stale-listing flexibility.
- Recommended offer: $158k (32.8% below list) — sets the bar for 1% rule.
- In year one you build about $25k of equity ($2k loan paydown + $24k appreciation (10.0% local appreciation)).
- Location reads 80/100 on livability (#130 in OH, #1,856 nationally) — a professional / high-income tenant draw. Strengths: amenities A+, commute A+, cost of living A+; Watch: employment D, crime F.
- Cincinnati Public Schools (urban): math 25% / reading 36% proficiency, ranked #581 of 656 in OH (top 89%) — families likely to look elsewhere, expect single-tenant / working-renter base with shorter leases; 70% free/reduced lunch — lower-income household profile, screen leases tightly.
- Watch-outs: built in 1924 — expect roof / HVAC / electrical / plumbing capex.
- Market conditions: 32 active listings in the ZIP; 36 comparable units currently listed for rent nearby; rentals at typical pace (median 25d on market — plan ~3-4 weeks tenant-placement turnaround); lower-income renter base — watch delinquency; 801 units permitted in Hamilton County in 2024 (190 in 5+ unit buildings).
- By year 2, paydown + projected appreciation supports a ~$40k cash-out refi (75% LTV) — recoverable capital for the next deal without selling this one.
- Cap rate 5.3% vs local median 3.9% in Cincinnati — top-decile yield for the area; either an underpriced asset or a hidden risk that comps aren't pricing in. Stress-test before assuming the spread holds.
- At $1,580/mo this rent would consume 93% of the median local household income ($20k/yr) (locally 1466% of renters already pay >50% of income on rent) — very limited rent-growth headroom before tenants either downsize or default.
Questions for listing agent
- What do current leases actually rent for vs. the listed asking? Can we see a recent rent roll and the last 12 months of T-12 income?
- It's been on market 49 days. Have you received any prior offers? Is the seller open to a 33% concession, seller financing, or rate buy-down credit?
- Built in 1924 — when were the roof, HVAC, electrical panel, plumbing, and water heater last replaced?
- Is there a deadline driving the sale (1031 exchange, divorce, estate, relocation)? That informs how much negotiation room exists.
- Schools are B-rated — typically a magnet for longer-tenancy family renters. What's the average tenant stay here, and is there a school-zone premium baked into asking?
- Crime grade is F in this area — have there been break-ins, vandalism, or insurance claims at this property in the last 3 years? What carrier currently insures it and at what premium?
- The area grade is low — what's the realistic commute time and amenity access for the typical tenant pool here? Any planned neighborhood developments (good or bad) we should know about?
- What's the average days-on-market for RENTAL listings here right now (not sales)? A rising rental-DOM trend means longer vacancies and softer asking-rent achievability than the comps imply.
CashFlowRE · CFR-DFAFJZ1CD5QS9G
· Data 3 days ago
cashflowre.app · 2026-05-29