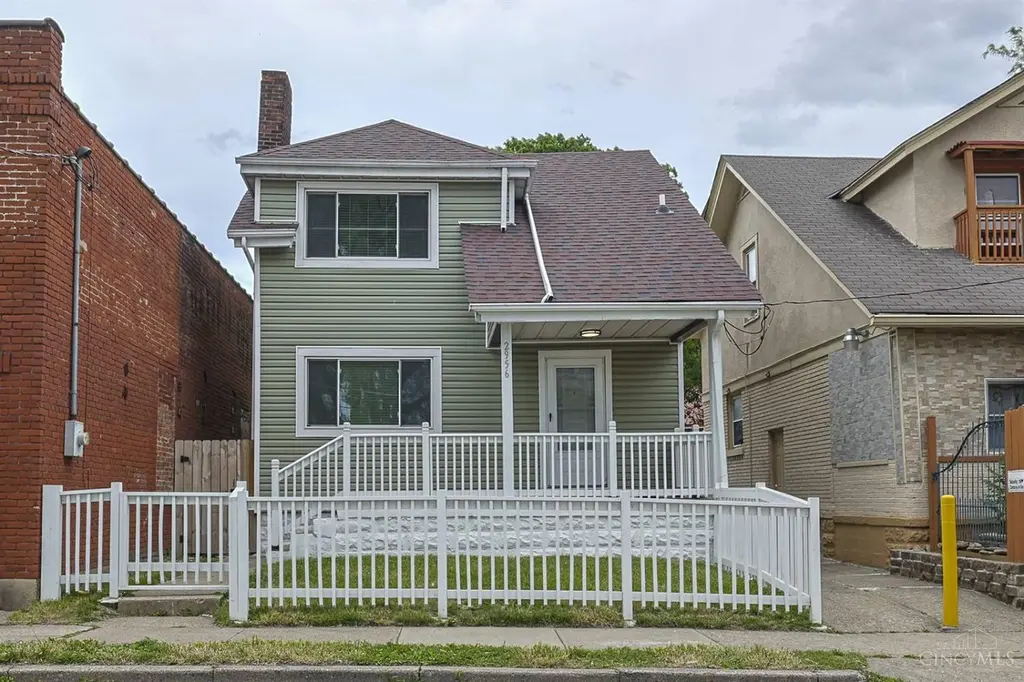
2956 Henshaw Ave · Cincinnati, OH
Flood risk No data
- FEMA flood zone
- —
- Chance of flooding over 30 yrs
- —
- Est. flood insurance / yr
- —
Fire risk No data
- Est. fire insurance / yr
- —
Heat risk No data
- Hot days now (above threshold)
- —
- Hot days in 30 yrs
- —
Wind risk No data
- Chance of severe wind over 30 yrs
- —
Air-quality risk No data
- Unhealthy air days now
- —
- Unhealthy air days in 30 yrs
- —
Risk factors via First Street. Map © Google.
Why this score? — see what drove the D grade
The composite is a weighted blend of 9 inputs, each scored 0–100. Each bar is that input's sub-score; the figure is the points it added to the 100-point composite (weight × sub-score).
- Appreciation +10.0/10.0
- Cash flow +8.9/30.0
- ARV discount +7.5/15.0
- Livability +4.0/5.0
- DSCR +2.5/10.0
- Rent growth +2.5/5.0
- Schools +2.5/10.0
- Condition / age +2.5/5.0
- 1% rule +1.7/10.0
$235,000
🖨 Deal sheet 📄 Offer letter ✓ Due diligence
Listing remarks
Total rehab. Charming house with private fenced in yard. Ready to move in!
Key facts
- 3,180 sq ft lot
- Built 1924
- Listed 49 days
Property features AI
Finance
- Other: Residential zoning
- HOA & community: No homeowners association
Exterior
- Parking: On-street parking
- Security: Insulated vinyl windows
- Utilities: Public water; Public sewer; Natural gas
- Home design: Traditional single-family home; Two levels; Block foundation; Vinyl siding; Shingle roof; Less than 0.5 acre lot (approx. 33 x 100)
- Construction: Vinyl siding construction; Block foundation; Shingle roof
- Exterior features: Deck; Porch; Wood fence
Interior
- Kitchen: Wood cabinets; Laminate floors; Microwave, Oven/Range, Refrigerator
- Bedrooms: Three bedrooms (all on the second floor); primary approx. 12 x 11, second bedroom approx. 12 x 11, third bedroom approx. 10 x 8
- Flooring: Laminate flooring in living room, dining room, and kitchen
- Bathrooms: One full bathroom (on second floor); One partial bathroom (in lower level)
- Heating & cooling: Forced air gas heating; Central air conditioning; Gas water heater; Programmable thermostat
- Interior features: Multi-panel doors; Walkout from kitchen; Basement is unfinished with concrete floor and glass block windows; One gas fireplace with ceramic surround
- Laundry & utility: 220 volt electrical service
Neighborhood map
What this means for you Summary
Snapshot
- This is a 3-bed/1.0-bath single-family listed at $235k.
Deal economics
- At list price, monthly cash flow is $-189 ($-2k/yr) — negative.
- To cash-flow at today's rent, offer at most $202k (14.2% below list).
- To meet the 1% rule (rent ≥ 1% of price), the offer needs to be $158k (32.8% below list).
- Recommended offer: $158k (32.8% below list) — sets the bar for 1% rule.
- Cap rate 5.3% vs local median 3.9% in Cincinnati — top-decile yield for the area; either an underpriced asset or a hidden risk that comps aren't pricing in. Stress-test before assuming the spread holds.
Location & tenants
- Location reads 80/100 on livability (#130 in OH, #1,856 nationally) — a professional / high-income tenant draw. Strengths: amenities A+, commute A+, cost of living A+; Watch: employment D, crime F.
- Cincinnati Public Schools (urban): math 25% / reading 36% proficiency, ranked #581 of 656 in OH (top 89%) — families likely to look elsewhere, expect single-tenant / working-renter base with shorter leases; 70% free/reduced lunch — lower-income household profile, screen leases tightly.
- Market conditions: 32 active listings in the ZIP; 36 comparable units currently listed for rent nearby; rentals at typical pace (median 24d on market — plan ~3-4 weeks tenant-placement turnaround); lower-income renter base — watch delinquency; 801 units permitted in Hamilton County in 2024 (190 in 5+ unit buildings).
- At $1,580/mo this rent would consume 93% of the median local household income ($20k/yr) (locally 1466% of renters already pay >50% of income on rent) — very limited rent-growth headroom before tenants either downsize or default.
Forward outlook
- In year one you build about $25k of equity ($2k loan paydown + $24k appreciation (10.0% local appreciation)).
- By year 2, paydown + projected appreciation supports a ~$40k cash-out refi (75% LTV) — recoverable capital for the next deal without selling this one.
Negotiation context
- It's been on market 49 days — a 3% lower offer ($228k) is reasonable based on typical stale-listing flexibility.
Risks & watch-outs
- Watch-outs: built in 1924 — expect roof / HVAC / electrical / plumbing capex.
Questions for the listing agent
- What do current leases actually rent for vs. the listed asking? Can we see a recent rent roll and the last 12 months of T-12 income?
- It's been on market 49 days. Have you received any prior offers? Is the seller open to a 33% concession, seller financing, or rate buy-down credit?
- Built in 1924 — when were the roof, HVAC, electrical panel, plumbing, and water heater last replaced?
- Is there a deadline driving the sale (1031 exchange, divorce, estate, relocation)? That informs how much negotiation room exists.
- Schools are B-rated — typically a magnet for longer-tenancy family renters. What's the average tenant stay here, and is there a school-zone premium baked into asking?
- Crime grade is F in this area — have there been break-ins, vandalism, or insurance claims at this property in the last 3 years? What carrier currently insures it and at what premium?
- The area grade is low — what's the realistic commute time and amenity access for the typical tenant pool here? Any planned neighborhood developments (good or bad) we should know about?
- What's the average days-on-market for RENTAL listings here right now (not sales)? A rising rental-DOM trend means longer vacancies and softer asking-rent achievability than the comps imply.
- What's the recent tenant-quality profile in this submarket — average credit score on applications, eviction rate, late-payment / NSF rate, and stable-employment percentage? A property-management company in the area should have these aggregated.
- How much new for-sale + rental construction is in the pipeline within 1–3 miles? Heavy new supply typically softens prices + rents 12–24 months out; constrained supply supports both.
Investment metrics
- 1% rule
- 0.67% ✗
- Cap rate
- 5.33%
- Cash-on-cash
- -3.45%
- DSCR
- 0.85
- GRM
- 12.4
CMA / ARV
- ARV (on-the-fly)
- $126,616
- Comps found
- 9
Show comp detail 9 sales within ~0.75 mi
| Address | Dist | Beds/Ba | Sqft | Sold | Price | $/sf | Match |
|---|---|---|---|---|---|---|---|
| 2946 W Mcmicken Ave | 0.28mi | 2/1.0 (-1) | 1,043 (-2%) | 5mo | $110,000 | $105 | 75 |
| 1623 Sutter Ave | 0.72mi | 3/2.0 | 1,097 (+3%) | 6mo | $39,900 | $36 | 52 |
| 1346 Ethan Ave | 0.37mi | 2/2.0 (-1) | 1,200 (+13%) | 4mo | $212,000 | $177 | 49 |
| 2911 Maisel Dr | 0.38mi | 4/2.0 (+1) | 912 (-14%) | 3mo | $124,410 | $136 | 47 |
| 642 Clemmer Ave | 0.67mi | 2/1.0 (-1) | 1,137 (+7%) | 12mo | $285,000 | $251 | 42 |
| 2622 Halstead St | 0.54mi | 2/1.5 (-1) | 1,120 (+5%) | 22mo | $164,900 | $147 | 40 |
| 1613 Pulte St | 0.67mi | 2/2.0 (-1) | 1,200 (+13%) | 3mo | $43,000 | $36 | 36 |
| 1533 Grove St | 0.70mi | 2/1.0 (-1) | 1,008 (-5%) | 23mo | $80,000 | $79 | 34 |
| 1531 Grove St | 0.69mi | 3/2.0 | 1,192 (+12%) | 19mo | $142,000 | $119 | 28 |
Match score weights: distance 35% · size 25% · config 20% · recency 20%. Top-matched comps best support the ARV.
Projected returns pro-forma
10.0% appreciation · 3.0% rent growth · sell at horizon
- IRR
- 21.8%
- Equity multiple
- 2.76×
- Total profit
- $115,840
- Equity at exit
- $211,707
- IRR
- 19.6%
- Equity multiple
- 6.33×
- Total profit
- $350,432
- Equity at exit
- $456,553
Cash invested: $65,800 (down + closing). Projections, not guarantees.
Landlord ↔ Tenant lean methodology
- Overall (STATE)
- 73 Landlord-Friendly
- State Ohio
- 73 Landlord-Friendly · R+6
- County
- — inherits STATE
- City
- — inherits STATE
ZIP-level market 45225
- Home prices YoY
- 4.6%
- Active inventory
- 32
- Price-to-rent
- 12.4×
Monthly cashflow live
- Estimated rent
- $1,580 high interval (Pro) →
- Mortgage (P&I)
- −$1,232
- Tax from tax record
- −$107 /mo · $1,290/yr
- Insurance
- −$98
- HOA
- −$0
- Vacancy / Maint / Mgmt
- −$332
- Net cashflow
- $-189
Break-even live
UW: 25.0% down · 7.5% · 30yr · 1.5% tax · 5.0% vac · 8.0% maint · 8.0% mgmt
Financing live
Cash to close
- Down payment
- $58,750
- Closing costs
- $7,050
- Reserves months
- —
- Total cash needed
- —
Loan-product check · same deal, 3 products live
Conventional
25% down · 7.5% · 30yr
- Down + closing
- —
- Monthly P&I
- —
- Monthly cashflow
- —
- DSCR
- —
- Eligible?
- —
Personal DTI + credit; lowest rate.
DSCR
20% down · 8.5% · 30yr
- Down + closing
- —
- Monthly P&I
- —
- Monthly cashflow
- —
- DSCR
- —
- Eligible?
- —
No personal income docs; deal must DSCR.
Hard money
10% down · 12.0% · 12mo
- Down + closing
- —
- Monthly P&I
- —
- Monthly cashflow
- —
- DSCR
- —
- Eligible?
- —
Short-term bridge; refi at stabilization.
Rent comps 36 comps
| Address | Beds | Baths | Sqft | Rent | $/sqft | DOM | Units | Dist |
|---|---|---|---|---|---|---|---|---|
| 1042 Marshall Ave Apt 3 Cincinnati, OH | 3.0 | 1.0 | 1400 | $1,195 | $0.85 | 24d | 1 | 0.34mi |
| 1048 Marshall Ave Unit 5 Cincinnati, OH | 2.0 | 1.0 | 888 | $965 | $1.09 | 24d | 1 | 0.34mi |
| 717 Martin Luther King Dr W Cincinnati, OH | 2.0 | 1.0–2.0 | 767 | $1,875 | $2.44 | 2d | 56 | 0.35mi |
| 521 Martin Luther King Dr W Apt A6 Cincinnati, OH | 2.0 | 1.5 | 925 | $1,495 | $1.62 | 3d | 1 | 0.60mi |
| 521 Martin Luther King Dr W Unit A15 Cincinnati, OH | 2.0 | 2.0 | 935 | $2,000 | $2.14 | 24d | 1 | 0.61mi |
| 539 Lowell Ave Unit 539-07 Cincinnati, OH | 2.0 | 1.0 | 800 | $1,095 | $1.37 | 4d | 1 | 0.62mi |
| 2556 Beekman St Unit 301 Cincinnati, OH | 2.0 | 1.0 | 1000 | $950 | $0.95 | 24d | 1 | 0.62mi |
| 525 Lowell Ave Unit 525-05 Cincinnati, OH | 2.0 | 1.0 | 880 | $1,295 | $1.47 | 17d | 1 | 0.65mi |
| 525 Lowell Ave Unit 525-07 Cincinnati, OH | 2.0 | 1.0 | 880 | $1,295 | $1.47 | 2d | 1 | 0.65mi |
| 3240 Whitfield Ave Cincinnati, OH | 1.0–2.0 | 1.0–2.0 | 865 | $2,225 | $2.57 | 2d | 80 | 0.70mi |
| 2805 Stratford Ave Unit 2 Cincinnati, OH | 2.0 | 1.0 | 850 | $1,450 | $1.71 | 4d | 1 | 0.78mi |
| 1 Foxhall Ct Unit 1 Cincinnati, OH | 2.0 | 2.5 | 1500 | $2,200 | $1.47 | 24d | 1 | 0.80mi |
| 421 Southview Ave Unit 2 Cincinnati, OH | 3.0 | 1.0 | 1350 | $1,800 | $1.33 | 24d | 1 | 0.83mi |
| 3015 Clifton Ave Unit 3015-02 Cincinnati, OH | 2.0 | 1.0 | 1050 | $995 | $0.95 | 24d | 1 | 0.84mi |
| 3404 Whitfield Ave Cincinnati, OH | 2.0 | 1.0 | 1291 | $1,595 | $1.23 | 4d | 55 | 0.85mi |
| 359 Ludlow Ave Cincinnati, OH | 2.0 | 1.0 | 1400 | $1,350 | $0.96 | 24d | 1 | 0.88mi |
| 348 Volkert Ave Cincinnati, OH | 4.0 | 2.5 | 1400 | $2,800 | $2.00 | 24d | 1 | 0.90mi |
| 358 Shiloh St Cincinnati, OH | 1.0–3.0 | 1.0 | 1400 | $2,100 | $1.50 | 2d | 1 | 0.94mi |
| 332 Ludlow Ave Cincinnati, OH | 2.0 | 1.0 | 579 | $1,095 | $1.89 | 4d | 10 | 0.95mi |
| 265 W McMillan St Unit 1 Cincinnati, OH | 2.0 | 1.0 | 950 | $1,350 | $1.42 | 20d | 1 | 0.97mi |
| 445 W McMicken Ave Cincinnati, OH | 3.0 | 1.0 | 1090 | $1,350 | $1.24 | 24d | 1 | 1.17mi |
| 3227 Bishop St Unit 3227-02 Cincinnati, OH | 2.0 | 2.0 | 718 | $1,495 | $2.08 | 4d | 1 | 1.18mi |
| 3227 Bishop St Unit 3227-06 Cincinnati, OH | 2.0 | 2.0 | 718 | $1,595 | $2.22 | 24d | 1 | 1.18mi |
| 3141 Bishop St Unit 3 Cincinnati, OH | 2.0 | 1.0 | 900 | $1,100 | $1.22 | 24d | 1 | 1.19mi |
| 3141 Bishop St Unit 1 Cincinnati, OH | 3.0 | 1.0 | 1500 | $2,100 | $1.40 | 24d | 1 | 1.19mi |
| 3263 Bishop St Cincinnati, OH | 3.0 | 2.0 | 1465 | $2,395 | $1.63 | 24d | 1 | 1.20mi |
| 2333 W Clifton Ave Cincinnati, OH | 2.0 | 1.0 | 1000 | $1,200 | $1.20 | 24d | 1 | 1.20mi |
| 231 Emming St Unit 2 Cincinnati, OH | 3.0 | 1.0 | 1200 | $1,800 | $1.50 | 24d | 1 | 1.25mi |
| 3227 Jefferson Ave Unit 3227-01 Cincinnati, OH | 2.0 | 1.0 | 890 | $1,345 | $1.51 | 24d | 1 | 1.26mi |
| 1925 Colerain Ave Unit 1056034P Cincinnati, OH | 2.0 | 1.0 | 1453 | $2,790 | $1.92 | 12d | 1 | 1.29mi |
| 3429 Ruther Ave Unit 1 Cincinnati, OH | 2.0 | 1.0 | 1200 | $1,500 | $1.25 | 4d | 1 | 1.34mi |
| 812 Dayton St Unit 1056021P Cincinnati, OH | 3.0 | 1.0 | 1453 | $2,995 | $2.06 | 2d | 1 | 1.36mi |
| 2809 Glendora Ave Cincinnati, OH | 2.0 | 1.0 | 1100 | $1,500 | $1.36 | 3d | 1 | 1.42mi |
| 414 Dayton St Cincinnati, OH | 3.0 | 2.5 | 1176 | $2,400 | $2.04 | 24d | 1 | 1.43mi |
| 207 W McMicken Ave Unit 3 Cincinnati, OH | 2.0 | 1.0 | 990 | $1,400 | $1.41 | 24d | 1 | 1.48mi |
| 2504 White St Apt 5 Cincinnati, OH | 3.0 | 2.0 | 1150 | $1,150 | $1.00 | 24d | 1 | 1.50mi |
Listing history 15 events
-
2026-06-18days on market $235,000 Active 49 DOM
-
2026-06-17days on market $235,000 Active 48 DOM
-
2026-06-16days on market $235,000 Active 47 DOM
-
2026-06-15days on market $235,000 Active 46 DOM
-
2026-06-13days on market $235,000 Active 44 DOM
-
2026-06-13days on market $235,000 Active 43 DOM
-
2026-06-09days on market $235,000 Active 40 DOM
-
2026-06-08days on market $235,000 Active 39 DOM
-
2026-06-07days on market $235,000 Active 38 DOM
-
2026-06-03days on market $235,000 Active 34 DOM
-
2026-06-02days on market $235,000 Active 33 DOM
-
2026-06-02price $235,000 Active 32 DOM
-
2026-06-01days on market $245,000 Active 32 DOM
-
2026-05-31days on market $245,000 Active 31 DOM
-
2026-05-01$245,000 Active
ⓘ Source: listings_history table (triggers on properties + properties_extension) + one-shot
backfill from property_details.listing_events for pre-trigger history.
Tax reassessment forecast OH · Partial reset (capped growth)
- Current annual tax
- $1,290 · $107/mo
- Projected year-2 tax
- $2,478 · $206/mo
- Expected delta
- +$1,188/yr (+$99/mo · 92.1%)
ⓘ Screening estimate from a state-policy table — verify with the county assessor before closing.
Nearby sold comps map
Loading sold comps map…
Walkable amenities ~0.75 mi
Loading nearby amenities…
Taxation est. · year 1
- Rental income
- $18,964
- − Mortgage interest
- −$13,164
- − Property taxes
- −$1,290
- − Insurance
- −$1,175
- − Repairs & maintenance
- −$1,517
- − Management
- −$1,517
- − Depreciation
- −$6,836
- Taxable loss
- −$6,535
- Est. tax savings @ 24.0%
- +$1,568
- After-tax cash flow
- $-703/yr
For passive investors: Depreciation is non-cash, so a rental often shows a tax loss while cash-flowing — sheltering income. Rental losses are passive: they offset passive income freely, and up to $25,000/yr can offset ordinary (W-2) income if you actively participate and your MAGI is under $100k (phasing out to $0 by $150k); unused losses carry forward. On sale, claimed depreciation is recaptured at up to 25%, and gains may owe capital-gains tax (a 1031 exchange can defer both). Figures are a year-1 estimate at your 24.0% rate — not tax advice; consult a CPA.
Schools (NCES district)
- District
- Cincinnati Public Schools
- NCES district ID
- 3904375
- Math proficiency
- 25% ▼ -19.00%
- Reading proficiency
- 36% ▼ -14.00%
- Median HH income
- $35,743
- Composite
- 25.21/100
- National rank
- #7508
- State rank
- #581 of 656 in OH
Livability — Cincinnati
- Score
- 80/100
- State rank
- #130
- US rank
- #1856
Category grades
Schools grade is shown separately in the Schools card above.
Census & demographics
- Census place
- Cincinnati, OH
- County
- Hamilton County · 701,295 people
- City population
- 505,555
- Metro
- Cincinnati, OH-KY-IN
- Population (ZIP)
- 9,583
- Household income
- $20,348
- Rent vs Own
- Severe rent burden
- 1466.0
Population outlook (Hamilton County) Hauer SSP2
- Today (2025)
- 826,054 people
- By 2030
- 830,947 · +0.6%
- By 2040
- 832,319 · +0.8%
- By 2050
- 822,428 · -0.4%
- By 2075
- 788,688 · -4.5%
- By 2100
- 710,674 · -14.0%
Race, ethnicity, and origin ACS 2023
- Neighborhood character
- Predominantly Black (72%)
- Race & ethnicity
- Black 72% White 17% Two or more races 7% Hispanic / Latino 5%
- Common ancestry
- Slovak 1% Romanian 1%
- Foreign-born
- 6% · Canada
- Languages at home
- 92% English-only · Spanish 2%
Political lean MEDSL · Hamilton
- 2024 margin
- D (+14.9) · D 57.0% · R 42.1%
- 2008→2024 swing
- +7.9pp toward D · 2008: 7.0pp · 2024: 14.9pp
- All cycles
- 2024: D+14.9 2020: D+15.9 2016: D+9.5 2012: D+4.9 2008: D+7.0
Not yet ingested
- Civics
- —
Market trends
- HPI YoY
- ▲ 10.21%
- Current HPI
- 232.7908
- Rent YoY
- —
- Metro
- Cincinnati, OH-KY-IN
- State GDP YoY
- ▲ 1.98%
- F500 in state
- 48
Industry mix (Fortune 500 HQ in OH)
| Industry | F500 HQs | Revenue |
|---|---|---|
| Insurance | 3 | $145B |
|
||
| Industrial Machinery | 3 | $49B |
|
||
| Financial Services | 3 | $24B |
|
||
| Consumer Goods | 2 | $93B |
|
||
| Aerospace / Defense | 2 | $47B |
|
||
| Utilities | 2 | $33B |
|
||
Price history
1 event — show timeline
- 2026-05-01 Listed $245,000 Cincy MLS
Property tax history
+6.6%/yrLatest (2025): $1,290 · +0.1% YoY. Source: county tax records.
Cash-flow waterfall
monthlySold comps — $/sqft
last 12 mo · ≤1 miLoading sold comps…