2555 Pga Blvd #345
Palm Beach Gardens, FL 33410
$134,000B
3 bd · 2.0 ba ·
1,620 sqft ·
Built 2017
· Manufactured
· Active
· 18 DOM
Cashflow @ list (25.0% down · 7.5%)
Estimated rent
$3,777/mo
Mortgage (P&I)
−$703
Tax + insurance
−$223
HOA
−$1,563
Vac / Maint / Mgmt
−$793
Net cashflow
$495/mo
Annual
$5,934/yr
Cap rate
10.72%
Cash-on-cash
15.82%
DSCR
1.70
1% rule
2.82%
Cash to close
$37,520
Investor read
- This is a 3-bed/2.0-bath manufactured listed at $134k. Condition is rated average.
- At list price, monthly cash flow is $495 ($6k/yr) — positive.
- The deal already cash-flows at list — no discount required.
- Meets the 1% rule at list price ($4k rent vs $134k).
- It's been on market 18 days — a 2% lower offer ($132k) is reasonable based on typical stale-listing flexibility.
- Recommended offer: $132k (1.5% below list) — sets the bar for market timing.
- Local home prices are declining (-3.0%/yr); year-one equity from $926 of loan paydown is wiped out by about $4k of value loss. Plan a longer hold.
- Location reads 69/100 on livability (#464 in FL) — a middle-class / working-renter tenant base. Strengths: crime A+, employment A+, housing A+; Watch: amenities F, commute F, cost of living F.
- Palm Beach (suburban): math 46% / reading 53% proficiency, ranked #34 of 73 in FL (top 47%) — families likely to look elsewhere, expect single-tenant / working-renter base with shorter leases.
- Watch-outs: HOA is 41% of rent.
- Market conditions: Rents rising (+2.5%/yr); 303 active listings in the ZIP; 40 comparable units currently listed for rent nearby; rentals at typical pace (median 25d on market — plan ~3-4 weeks tenant-placement turnaround); solid renter incomes; 3,974 units permitted in Palm Beach County in 2024 (1,012 in 5+ unit buildings).
- Palm Beach County population projected at +30% by 2050 — long-run rental-demand tailwind backs the buy-and-hold thesis.
- At projected returns (-3.0% appreciation + 2.5% rent growth), your $38k cash investment doubles in ~8 years — after that, you're playing with house money.
- Climate carrying-cost: moderate flood risk; severe wind risk, 99% chance of damaging wind over 30y; extreme-heat days projected 7→25/yr by 2055 (HVAC capex compounding) — expect insurance premiums to compound above CPI over the hold.
- At $3,777/mo this rent would consume 48% of the median local household income ($95k/yr) (locally 1429% of renters already pay >50% of income on rent) — very limited rent-growth headroom before tenants either downsize or default.
Questions for listing agent
- What does the HOA fee cover, when was the last increase, and are there any pending special assessments or reserve-fund shortfalls?
- Is there a deadline driving the sale (1031 exchange, divorce, estate, relocation)? That informs how much negotiation room exists.
- Schools are B-rated — typically a magnet for longer-tenancy family renters. What's the average tenant stay here, and is there a school-zone premium baked into asking?
- What's the average days-on-market for RENTAL listings here right now (not sales)? A rising rental-DOM trend means longer vacancies and softer asking-rent achievability than the comps imply.
- What's the recent tenant-quality profile in this submarket — average credit score on applications, eviction rate, late-payment / NSF rate, and stable-employment percentage? A property-management company in the area should have these aggregated.
- How much new for-sale + rental construction is in the pipeline within 1–3 miles? Heavy new supply typically softens prices + rents 12–24 months out; constrained supply supports both.
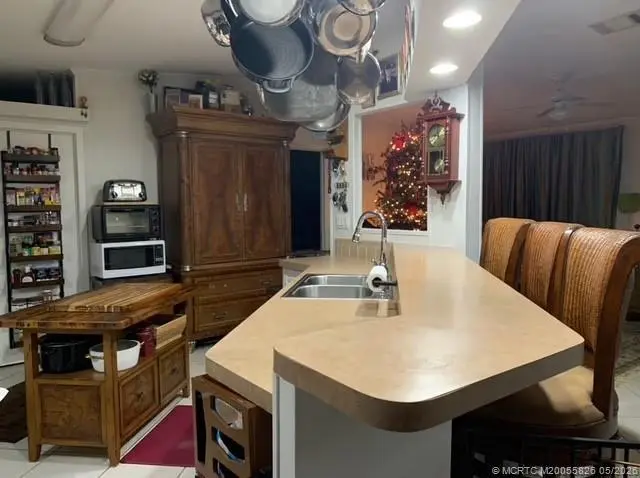
Repairs flagged (vision-AI assessment)
- Minor: Kitchen cabinets — No visible damage to the cabinets.
- Minor: Bathroom fixtures — No visible damage to the fixtures.
- Minor: Flooring — No visible damage to the flooring.
- Minor: Paint — No visible damage to the paint on the walls and ceiling.
CashFlowRE · CFR-DFH7H2DP6MTHVH
· Data 2 days ago
cashflowre.app · 2026-05-29