2555 Pga Blvd #345 · Palm Beach Gardens, FL
Flood risk 5/10 · Moderate
- FEMA flood zone
- X (shaded)
- Chance of flooding over 30 yrs
- 0.24%
- Est. flood insurance / yr
- $507 – $1,088
Fire risk 1/10 · Minimal
- Est. fire insurance / yr
- $947 – $1,759
Heat risk 10/10 · Severe
- Hot days now (above 106°F)
- 7 days/yr
- Hot days in 30 yrs
- 25 days/yr
Wind risk 10/10 · Severe
- Chance of severe wind over 30 yrs
- 99.0%
Air-quality risk 2/10 · Minimal
- Unhealthy air days now
- 0 days/yr
- Unhealthy air days in 30 yrs
- 1 days/yr
Risk factors via First Street. Map © Google.
Why this score? — see what drove the B grade
The composite is a weighted blend of 9 inputs, each scored 0–100. Each bar is that input's sub-score; the figure is the points it added to the 100-point composite (weight × sub-score).
- Cash flow +30.0/30.0
- 1% rule +10.0/10.0
- DSCR +10.0/10.0
- ARV discount +7.5/15.0
- Schools +4.3/10.0
- Livability +3.5/5.0
- Rent growth +3.1/5.0
- Condition / age +2.8/5.0
- Appreciation +0.0/10.0
$134,000
🖨 Deal sheet 📄 Offer letter ✓ Due diligence
Listing remarks
Just Listed !!! Custom Built in 2017 this newer home is located in a Prime location available for all ages . Offering 3 bedrooms , Master Bedroom with Private Bath split from Bedrooms 2 & 3 , 2 baths , Screened Florida room with electrical outlets, Gourmet kitchen with extra large center island with seating, walk in laundry room, Formal Dining Room with room to seat 12 or can be a Family Room, Custom built Paver Patio with privacy , enjoy the hot tub , plus exterior shower with hot and cold water , large exterior space to relax and enjoy the outdoors. Bonus exterior shed set on a concrete foundation This home has so much to offer and it is priced to sell ! Enjoy walking to shopping
Key facts
- Hot tub
- Exterior shower
- Gourmet kitchen
Tags
Property features AI
Finance
- Other: Pets allowed with number and size limits
- HOA & community: Homeowners association present; HOA fee approximately $1,563.69; HOA covers common areas, cable TV, laundry, grounds maintenance, pool(s), recreation facilities, sewer, taxes, trash, and water; Community amenities include barbecue, basketball court, billiard room, bicycle storage, clubhouse, fitness center, game room, kitchen facilities, laundry facilities, non-gated community, playground, putting green, storage facilities
Exterior
- Parking: 2 parking spaces (2 covered)
- Utilities: Electricity connected
- Home design: Manufactured home; Single-story
- Construction: Manufactured construction; Resale
- Exterior features: Community pool; Community above-ground spa; Lot size approximately 0.2 acres
Interior
- Bathrooms: 2 full bathrooms
- Heating & cooling: Central heating; Central air conditioning
- Interior features: Unfurnished
Neighborhood map
What this means for you Summary
Snapshot
- This is a 3-bed/2.0-bath manufactured listed at $134k. Condition is rated average.
Deal economics
- At list price, monthly cash flow is $499 ($6k/yr) — positive.
- The deal already cash-flows at list — no discount required.
- Meets the 1% rule at list price ($4k rent vs $134k).
- Recommended offer: $132k (1.5% below list) — sets the bar for market timing.
Location & tenants
- Location reads 69/100 on livability (#464 in FL) — a middle-class / working-renter tenant base. Strengths: crime A+, employment A+, housing A+; Watch: amenities F, commute F, cost of living F.
- Palm Beach (suburban): math 46% / reading 53% proficiency, ranked #34 of 73 in FL (top 47%) — families likely to look elsewhere, expect single-tenant / working-renter base with shorter leases.
- Market conditions: Rents rising (+2.5%/yr); 303 active listings in the ZIP; 40 comparable units currently listed for rent nearby; rentals at typical pace (median 25d on market — plan ~3-4 weeks tenant-placement turnaround); solid renter incomes; 3,974 units permitted in Palm Beach County in 2024 (1,012 in 5+ unit buildings).
- At $3,782/mo this rent would consume 48% of the median local household income ($95k/yr) (locally 1429% of renters already pay >50% of income on rent) — very limited rent-growth headroom before tenants either downsize or default.
Forward outlook
- Local home prices are declining (-3.0%/yr); year-one equity from $926 of loan paydown is wiped out by about $4k of value loss. Plan a longer hold.
- Palm Beach County population projected at +30% by 2050 — long-run rental-demand tailwind backs the buy-and-hold thesis.
- At projected returns (-3.0% appreciation + 2.5% rent growth), your $38k cash investment doubles in ~8 years — after that, you're playing with house money.
Negotiation context
- It's been on market 18 days — a 2% lower offer ($132k) is reasonable based on typical stale-listing flexibility.
Risks & watch-outs
- Watch-outs: HOA is 41% of rent.
- Climate carrying-cost: moderate flood risk; severe wind risk, 99% chance of damaging wind over 30y; extreme-heat days projected 7→25/yr by 2055 (HVAC capex compounding) — expect insurance premiums to compound above CPI over the hold.
Questions for the listing agent
- What does the HOA fee cover, when was the last increase, and are there any pending special assessments or reserve-fund shortfalls?
- Is there a deadline driving the sale (1031 exchange, divorce, estate, relocation)? That informs how much negotiation room exists.
- Schools are B-rated — typically a magnet for longer-tenancy family renters. What's the average tenant stay here, and is there a school-zone premium baked into asking?
- What's the average days-on-market for RENTAL listings here right now (not sales)? A rising rental-DOM trend means longer vacancies and softer asking-rent achievability than the comps imply.
- What's the recent tenant-quality profile in this submarket — average credit score on applications, eviction rate, late-payment / NSF rate, and stable-employment percentage? A property-management company in the area should have these aggregated.
- How much new for-sale + rental construction is in the pipeline within 1–3 miles? Heavy new supply typically softens prices + rents 12–24 months out; constrained supply supports both.
Investment metrics
- 1% rule
- 2.82% ✓
- Cap rate
- 10.76%
- Cash-on-cash
- 15.95%
- DSCR
- 1.71
- GRM
- 3.0
CMA / ARV
No comps found within radius.
Projected returns pro-forma
-3.0% appreciation · 2.49% rent growth · sell at horizon
- IRR
- 6.3%
- Equity multiple
- 1.24×
- Total profit
- $9,142
- Equity at exit
- $19,980
- IRR
- 15.2%
- Equity multiple
- 2.20×
- Total profit
- $45,159
- Equity at exit
- $11,586
Cash invested: $37,520 (down + closing). Projections, not guarantees.
Landlord ↔ Tenant lean methodology
- Overall (STATE)
- 87 Strongly Landlord-Friendly
- State Florida
- 87 Strongly Landlord-Friendly · R+3
- County
- — inherits STATE
- City
- — inherits STATE
ZIP-level market 33410
- Rents YoY
- 2.5%
- Active inventory
- 303
- Price-to-rent
- 3.0×
Monthly cashflow live
- Estimated rent
- $3,782 high interval (Pro) →
- Mortgage (P&I)
- −$703
- Tax est. 1.5%
- −$168 /mo · $2,010/yr
- Insurance
- −$56
- HOA
- −$1,563
- Vacancy / Maint / Mgmt
- −$794
- Net cashflow
- $499
Break-even live
UW: 25.0% down · 7.5% · 30yr · 1.5% tax · 5.0% vac · 8.0% maint · 8.0% mgmt
Financing live
Cash to close
- Down payment
- $33,500
- Closing costs
- $4,020
- Reserves months
- —
- Total cash needed
- —
Loan-product check · same deal, 3 products live
Conventional
25% down · 7.5% · 30yr
- Down + closing
- —
- Monthly P&I
- —
- Monthly cashflow
- —
- DSCR
- —
- Eligible?
- —
Personal DTI + credit; lowest rate.
DSCR
20% down · 8.5% · 30yr
- Down + closing
- —
- Monthly P&I
- —
- Monthly cashflow
- —
- DSCR
- —
- Eligible?
- —
No personal income docs; deal must DSCR.
Hard money
10% down · 12.0% · 12mo
- Down + closing
- —
- Monthly P&I
- —
- Monthly cashflow
- —
- DSCR
- —
- Eligible?
- —
Short-term bridge; refi at stabilization.
Rent comps 40 comps
| Address | Beds | Baths | Sqft | Rent | $/sqft | DOM | Units | Dist |
|---|---|---|---|---|---|---|---|---|
| 2727 Anzio Ct #106 Palm Beach Gardens, FL | 3.0 | 2.0 | 1316 | $3,000 | $2.28 | 24d | 1 | 0.11mi |
| 2813 Grande Pkwy #109 Palm Beach Gardens, FL | 3.0 | 2.0 | 1278 | $2,818 | $2.21 | 24d | 1 | 0.20mi |
| 2916 Tuscany Ct Palm Beach Gardens, FL | 3.0 | 2.0 | 1278 | $2,818 | $2.21 | 24d | 1 | 0.20mi |
| 2916 Tuscany Ct #201 Palm Beach Gardens, FL | 2.0 | 2.0 | 1149 | $3,200 | $2.79 | 3d | 1 | 0.21mi |
| 2802 Sarento Pl #204 Palm Beach Gardens, FL | 2.0 | 2.0 | 1092 | $3,500 | $3.21 | 24d | 1 | 0.33mi |
| 2805 Veronia Dr Palm Beach Gardens, FL | 3.0 | 2.0 | 1361 | $3,000 | $2.20 | 24d | 1 | 0.36mi |
| 11860 Valencia Gardens Ave Palm Beach Gardens, FL | 3.0 | 3.5 | 2150 | $3,800 | $1.77 | 24d | 1 | 0.37mi |
| 3252 Florida Blvd Unit 1326857P Palm Beach Gardens, FL | 4.0 | 3.0 | 1593 | $7,046 | $4.42 | 3d | 1 | 0.55mi |
| 2395 Idlewild Rd Palm Beach Gardens, FL | 3.0 | 2.0 | 1476 | $4,500 | $3.05 | 22d | 1 | 0.59mi |
| 3270 Grove Rd Unit 1326860P Palm Beach Gardens, FL | 3.0 | 2.0 | 1496 | $5,047 | $3.37 | 7d | 1 | 0.59mi |
| 2388 S Wallen Dr West Palm Beach, FL | 3.0 | 2.0 | 1296 | $4,500 | $3.47 | 24d | 1 | 0.63mi |
| 3610 Gardens Pkwy Unit 402A Palm Beach Gardens, FL | 2.0 | 2.5 | 1831 | $5,500 | $3.00 | 24d | 1 | 0.65mi |
| 12015 Colony Ave Palm Beach Gardens, FL | 3.0 | 2.0 | 1104 | $3,100 | $2.81 | 24d | 1 | 0.65mi |
| 12015 Colony Ave Palm Beach Gardens, FL | 3.0 | 2.0 | 1104 | $3,100 | $2.81 | 22d | 1 | 0.65mi |
| 3630 Gardens Pkwy Unit 1104C Palm Beach Gardens, FL | 2.0 | 2.5 | 1831 | $5,250 | $2.87 | 19d | 1 | 0.68mi |
| 3630 Gardens Pkwy Unit 1004C Palm Beach Gardens, FL | 2.0 | 2.5 | 1831 | $5,000 | $2.73 | 24d | 1 | 0.68mi |
| 11021 Legacy Ln #303 Palm Beach Gardens, FL | 2.0 | 2.0 | 1403 | $2,950 | $2.10 | 24d | 1 | 0.79mi |
| 11023 Legacy Ln #204 Palm Beach Gardens, FL | 2.0 | 2.0 | 1309 | $3,500 | $2.67 | 24d | 1 | 0.81mi |
| 222 E Tall Oaks Cir Palm Beach Gardens, FL | 3.0 | 2.0 | 1577 | $5,000 | $3.17 | 22d | 1 | 0.81mi |
| 11900 Valencia Gardens Ave Palm Beach Gardens, FL | 1.0–3.0 | 1.0–2.0 | 980 | $3,002 | $3.06 | 1d | 18 | 0.84mi |
| 3745 Atlantic Rd Unit 3745 Palm Beach Gardens, FL | 4.0 | 2.0 | 1119 | $2,900 | $2.59 | 24d | 1 | 0.85mi |
| 160 Lost Bridge Dr Palm Beach Gardens, FL | 3.0 | 2.0 | 1826 | $4,500 | $2.46 | 15d | 1 | 0.86mi |
| 11011 Legacy Dr #306 Palm Beach Gardens, FL | 2.0 | 2.0 | 1403 | $4,350 | $3.10 | 24d | 1 | 0.89mi |
| 106 Renaissance Dr West Palm Beach, FL | 3.0 | 3.0 | 2021 | $6,000 | $2.97 | 24d | 1 | 0.90mi |
| 3640 Gull Rd Palm Beach Gardens, FL | 3.0 | 2.0 | 1382 | $2,975 | $2.15 | 7d | 1 | 0.91mi |
| 10201 Chapman Oak Ct Palm Beach Gardens, FL | 2.0 | 2.0 | 1152 | $4,000 | $3.47 | 24d | 1 | 0.95mi |
| 11024 Legacy Dr #104 Palm Beach Gardens, FL | 2.0 | 2.0 | 1345 | $6,000 | $4.46 | 24d | 1 | 0.98mi |
| 3818 Everglades Rd Palm Beach Gardens, FL | 4.0 | 1.5 | 1381 | $3,000 | $2.17 | 24d | 1 | 1.00mi |
| 11028 Legacy Dr #203 Palm Beach Gardens, FL | 2.0 | 2.0 | 1309 | $4,000 | $3.06 | 24d | 1 | 1.00mi |
| 3660 RCA Blvd Palm Beach Gardens, FL | 1.0–2.0 | 1.0–2.0 | 1524 | $6,849 | $4.49 | 1d | 30 | 1.01mi |
| 7102 Geminata Oak Ct Unit 7102 Palm Beach Gardens, FL | 2.0 | 2.0 | 1152 | $3,200 | $2.78 | 7d | 1 | 1.02mi |
| 2415 Laurel Ln West Palm Beach, FL | 2.0 | 2.5 | 1916 | $8,500 | $4.44 | 24d | 1 | 1.03mi |
| 2100 PGA Blvd Palm Beach Gardens, FL | 1.0–3.0 | 1.0–2.0 | 1044 | $3,509 | $3.36 | 1d | 10 | 1.06mi |
| 1891 Juno Landing Ln North Palm Beach, FL | 3.0 | 2.5 | 2138 | $5,450 | $2.55 | 4d | 1 | 1.07mi |
| 1950 Juno Landing Ln North Palm Beach, FL | 3.0 | 2.5 | 2138 | $4,950 | $2.32 | 17d | 1 | 1.07mi |
| 700 Sanctuary Cove Dr West Palm Beach, FL | 1.0–3.0 | 1.0–2.0 | 1120 | $3,167 | $2.83 | 1d | 55 | 1.09mi |
| 418 Capistrano Dr Palm Beach Gardens, FL | 3.0 | 2.5 | 1570 | $3,600 | $2.29 | 24d | 1 | 1.15mi |
| 3955 Design Center Dr Palm Beach Gardens, FL | 3.0 | 1.0–2.0 | 996 | $4,108 | $4.12 | 2d | 25 | 1.16mi |
| 4128 Chestnut Ave Palm Beach Gardens, FL | 3.0 | 2.0 | 1646 | $3,900 | $2.37 | 20d | 1 | 1.16mi |
| 4128 Chestnut Ave Palm Beach Gardens, FL | 3.0 | 2.0 | 1646 | $3,900 | $2.37 | 24d | 1 | 1.16mi |
HOA detail
- Monthly dues
- $1,563 · $18,756/yr
- Likely covers
- waterelectric
Listing history 13 events
-
2026-06-18days on market $134,000 Active 18 DOM
-
2026-06-17days on market $134,000 Active 17 DOM
-
2026-06-16days on market $134,000 Active 16 DOM
-
2026-06-15days on market $134,000 Active 15 DOM
-
2026-06-13days on market $134,000 Active 13 DOM
-
2026-06-09days on market $134,000 Active 9 DOM
-
2026-06-08days on market $134,000 Active 8 DOM
-
2026-06-07days on market $134,000 Active 7 DOM
-
2026-06-04days on market $134,000 Active 4 DOM
-
2026-06-03days on market $134,000 Active 3 DOM
-
2026-06-02days on market $134,000 Active 2 DOM
-
2026-06-01remarks 695-char remark
-
2026-06-01$134,000 Active 1 DOM
ⓘ Source: listings_history table (triggers on properties + properties_extension) + one-shot
backfill from property_details.listing_events for pre-trigger history.
Climate risk First Street
- Flood 5/10 Major FEMA zone X (shaded) · 24% chance over 30 yrs
- Wildfire 1/10 Low
- Heat 10/10 Extreme 7 d/yr ≥106°F today · 25 d/yr by 30 yrs out
- Wind 10/10 Extreme 99% chance of damaging wind over 30 yrs
- Air quality 2/10 Low 0 unhealthy d/yr today · 1 by 30 yrs out
Nearby sold comps map
Loading sold comps map…
Walkable amenities ~0.75 mi
Loading nearby amenities…
Taxation est. · year 1
- Rental income
- $45,385
- − Mortgage interest
- −$7,506
- − Property taxes
- −$2,010
- − Insurance
- −$670
- − Repairs & maintenance
- −$3,631
- − Management
- −$3,631
- − HOA
- −$18,756
- − Depreciation
- −$3,898
- Taxable income
- $5,283
- Est. tax owed @ 24.0%
- −$1,268
- After-tax cash flow
- $4,718/yr
For passive investors: Depreciation is non-cash, so a rental often shows a tax loss while cash-flowing — sheltering income. Rental losses are passive: they offset passive income freely, and up to $25,000/yr can offset ordinary (W-2) income if you actively participate and your MAGI is under $100k (phasing out to $0 by $150k); unused losses carry forward. On sale, claimed depreciation is recaptured at up to 25%, and gains may owe capital-gains tax (a 1031 exchange can defer both). Figures are a year-1 estimate at your 24.0% rate — not tax advice; consult a CPA.
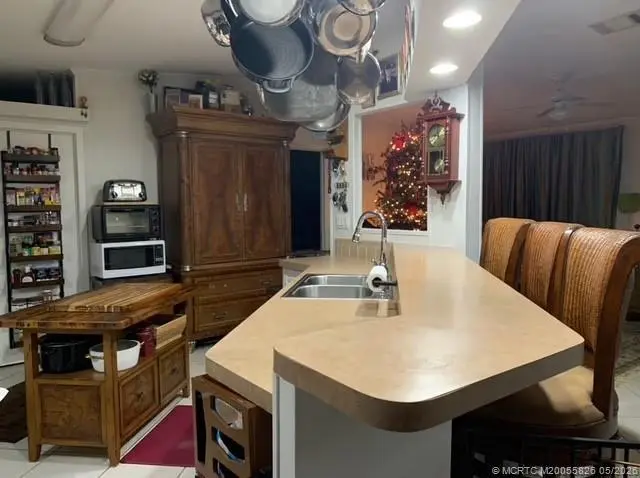
Condition & rehab AI · 12 photos
This home is in average condition with some minor repairs and maintenance needed. It has a good layout and potential for value increases with updates.
Repairs flagged
- Minor Kitchen cabinets — No visible damage to the cabinets.
- Minor Bathroom fixtures — No visible damage to the fixtures.
- Minor Flooring — No visible damage to the flooring.
- Minor Paint — No visible damage to the paint on the walls and ceiling.
Value-add opportunities
- Resale Paint kitchen cabinets — Fresh paint can make the kitchen appear more modern and appealing.
- Resale Replace kitchen countertops — New countertops can add value and functionality to the kitchen.
- Resale Replace bathroom fixtures — Upgraded fixtures can make the bathrooms more appealing and functional.
- Rental Replace living room carpet — Fresh carpet can make the living room more inviting and comfortable for tenants.
- Both Landscaping and curb appeal — A well-maintained exterior can enhance the home's curb appeal and attract more buyers/tenants.
Renovation cost estimate screening
| Repair item | Severity | Est. cost |
|---|---|---|
| Kitchen cabinets · No visible damage to the cabinets. | Minor | $500–3,000 |
| Bathroom fixtures · No visible damage to the fixtures. | Minor | $500–3,000 |
| Flooring · No visible damage to the flooring. | Minor | $500–3,000 |
| Paint · No visible damage to the paint on the walls and ceiling. | Minor | $500–3,000 |
| Total estimated repair cost · 4 items | $2,000–12,000 |
Value-add ROI direction
- Resale Paint kitchen cabinets — Fresh paint can make the kitchen appear more modern and appealing. ↑
- Resale Replace kitchen countertops — New countertops can add value and functionality to the kitchen. ↑
- Resale Replace bathroom fixtures — Upgraded fixtures can make the bathrooms more appealing and functional. ↑
- Rental Replace living room carpet — Fresh carpet can make the living room more inviting and comfortable for tenants. ↑
- Both Landscaping and curb appeal — A well-maintained exterior can enhance the home's curb appeal and attract more buyers/tenants. ↑
ⓘ Cost ranges are severity-bucket heuristics (US national rule-of-thumb). Get contractor quotes + a written scope before underwriting a rehab budget.
Schools (NCES district)
- District
- Palm Beach
- NCES district ID
- 1201500
- Math proficiency
- 46% ▼ -16.00%
- Reading proficiency
- 53% ▼ -4.00%
- Median HH income
- $53,943
- Composite
- 42.72/100
- National rank
- #3160
- State rank
- #34 of 73 in FL
Livability — Palm Beach Gardens
- Score
- 69/100
- State rank
- #464
- US rank
- #8366
Category grades
Schools grade is shown separately in the Schools card above.
Census & demographics
- Census place
- Palm Beach Gardens, FL
- County
- Palm Beach County · 1,438,312 people
- City population
- 96,294
- Metro
- Miami-Fort Lauderdale-Pompano Beach, FL
- Population (ZIP)
- 36,759
- Household income
- $94,530
- Rent vs Own
- Severe rent burden
- 1429.0
Population outlook (Palm Beach County) Hauer SSP2
- Today (2025)
- 1,637,487 people
- By 2030
- 1,743,255 · +6.5%
- By 2040
- 1,948,712 · +19.0%
- By 2050
- 2,132,979 · +30.3%
- By 2075
- 2,530,027 · +54.5%
- By 2100
- 2,706,979 · +65.3%
Race, ethnicity, and origin ACS 2023
- Neighborhood character
- Predominantly White (70%)
- Race & ethnicity
- White 70% Hispanic / Latino 15% Two or more races 13% Black 5% Asian 4%
- Hispanic origin (detail)
- Mexican 2% Puerto Rican 2% Cuban 3%
- Common ancestry
- Romanian 4% Lithuanian 3% Slovak 2%
- Foreign-born
- 17% · Canada, Jamaica, Vietnam
- Languages at home
- 78% English-only · Spanish 13% French/Haitian/Cajun 3% Other Indo-European 2%
Political lean MEDSL · Palm Beach
- 2024 margin
- Toss-up / Even · D 50.0% · R 49.2%
- 2008→2024 swing
- -22.1pp toward R · 2008: 22.9pp · 2024: 0.8pp
- All cycles
- 2024: D+0.8 2020: D+12.8 2016: D+15.3 2012: D+17.0 2008: D+22.9
Not yet ingested
- Civics
- —
Market trends
- HPI YoY
- ▼ -346.12%
- Current HPI
- 375.5381
- Rent YoY
- ▲ 2.49%
- Metro
- Miami-Fort Lauderdale-Pompano Beach, FL
- State GDP YoY
- ▲ 3.28%
- F500 in state
- 36
Industry mix (Fortune 500 HQ in FL)
| Industry | F500 HQs | Revenue |
|---|---|---|
| Industrial Technology | 2 | $29B |
|
||
| Insurance | 2 | $17B |
|
||
| Retail | 1 | $60B |
|
||
| Technology Distribution | 1 | $58B |
|
||
| Homebuilding | 1 | $35B |
|
||
| Technology Manufacturing | 1 | $35B |
|
||
Price history
1 event — show timeline
- 2026-05-29 Listed $134,000 MCRTC
Cash-flow waterfall
monthlySold comps — $/sqft
last 12 mo · ≤1 miLoading sold comps…