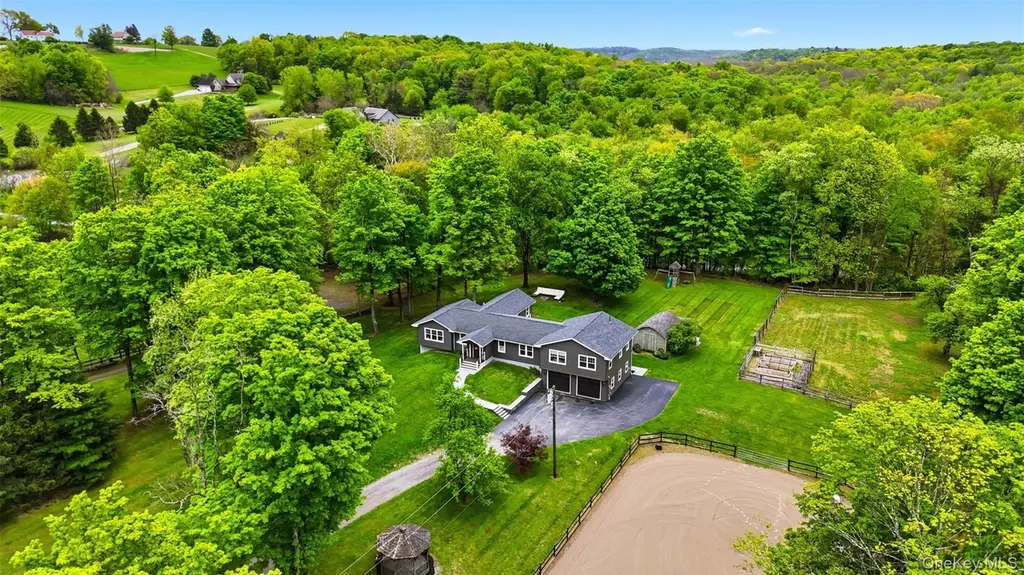
308 Hollow Rd
Staatsburg, NY 12580
$1,000,000F
3 bd · 2.5 ba ·
2,710 sqft ·
Built 1973
· SingleFamily
· Active
· 29 DOM
Cashflow @ list (25.0% down · 7.5%)
Estimated rent
$2,722/mo
Mortgage (P&I)
−$5,244
Tax + insurance
−$1,525
HOA
−$0
Vac / Maint / Mgmt
−$572
Net cashflow
$-4,618/mo
Annual
$-55,416/yr
Cap rate
0.75%
Cash-on-cash
-19.79%
DSCR
0.12
1% rule
0.27%
Cash to close
$280,000
Investor read
- This is a 3-bed/2.5-bath single-family listed at $1.00M.
- At list price, monthly cash flow is $-5k ($-55k/yr) — negative.
- To cash-flow at today's rent, offer at most $266k (73.4% below list).
- To meet the 1% rule (rent ≥ 1% of price), the offer needs to be $272k (72.8% below list).
- It's been on market 29 days — a 2% lower offer ($985k) is reasonable based on typical stale-listing flexibility.
- Recommended offer: $266k (73.4% below list) — sets the bar for cash-flow.
- Local home prices are declining (-3.0%/yr); year-one equity from $7k of loan paydown is wiped out by about $30k of value loss. Plan a longer hold.
- Location reads 66/100 on livability (#639 in NY) — a middle-class / working-renter tenant base. Strengths: housing A+, employment B+; Watch: cost of living C-, amenities F, commute F.
- Hyde Park Central School District (rural): math 43% / reading 62% proficiency, ranked #316 of 590 in NY (top 54%) — acceptable for families but not a draw, mixed tenant base, ~2y average lease.
- Zoned schools: North Park Elementary School (math 37% / reading 62%, grade D, #1,085 of 2,108 statewide, top 56%, 476 students, 50% FRL); Haviland Middle School (math 23% / reading 57%, grade F, #413 of 729 statewide, top 57%, 759 students, 59% FRL); Franklin D Roosevelt Senior High School (math 93% / reading 90%, grade A+, #197 of 1,100 statewide, top 18%, 1,136 students, 52% FRL) — zoned schools average 54% FRL vs 34% district-wide (20 pts higher); higher-poverty schools than district average — tighter screening recommended.
- Market conditions: 44 active listings in the ZIP; 620 units permitted in Dutchess County in 2024 (242 in 5+ unit buildings).
- Dutchess County population projected at -11% by 2050 — secular population decline; favor cash flow + early exit over multi-decade hold.
- Current owner paid $265k; list at $1.00M implies a 277% gain — meaningful room to come down on a strong offer.
- Cap rate 0.8% vs local median 2.5% in Staatsburg — below-typical yield; the buyer is paying a premium for something (appreciation thesis, condition, location) that the cap rate doesn't capture.
Questions for listing agent
- What do current leases actually rent for vs. the listed asking? Can we see a recent rent roll and the last 12 months of T-12 income?
- Built in 1973 — when were the roof, HVAC, electrical panel, plumbing, and water heater last replaced?
- Is there a deadline driving the sale (1031 exchange, divorce, estate, relocation)? That informs how much negotiation room exists.
- The area grade is low — what's the realistic commute time and amenity access for the typical tenant pool here? Any planned neighborhood developments (good or bad) we should know about?
- What's the average days-on-market for RENTAL listings here right now (not sales)? A rising rental-DOM trend means longer vacancies and softer asking-rent achievability than the comps imply.
- What's the recent tenant-quality profile in this submarket — average credit score on applications, eviction rate, late-payment / NSF rate, and stable-employment percentage? A property-management company in the area should have these aggregated.
- How much new for-sale + rental construction is in the pipeline within 1–3 miles? Heavy new supply typically softens prices + rents 12–24 months out; constrained supply supports both.
CashFlowRE · CFR-DFK1EHF3QTYFK2
· Data 2 days ago
cashflowre.app · 2026-05-29