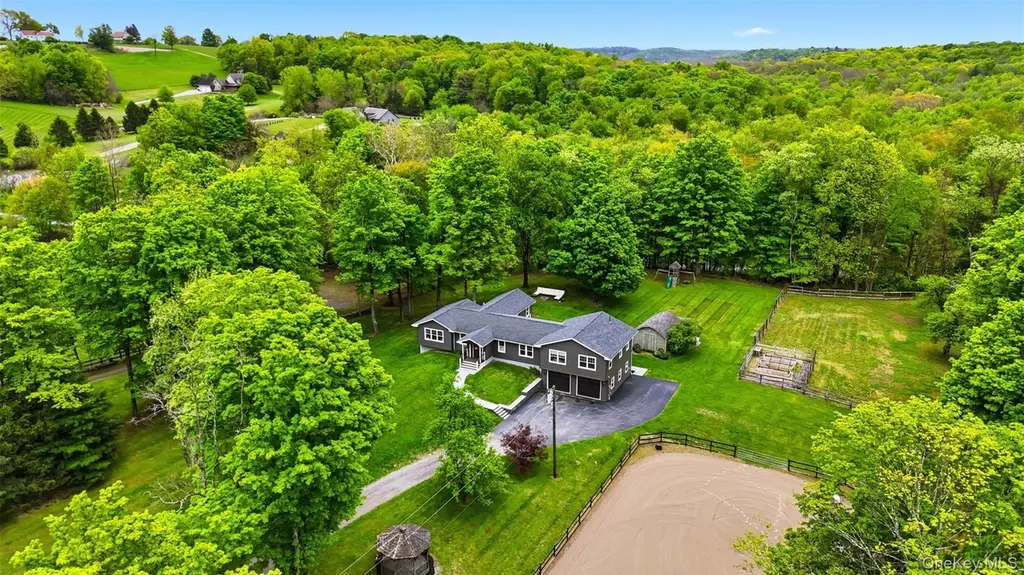
308 Hollow Rd · Staatsburg, NY
Flood risk 1/10 · Minimal
- FEMA flood zone
- X (unshaded)
- Chance of flooding over 30 yrs
- 0.0%
- Est. flood insurance / yr
- $473 – $860
Fire risk 4/10 · Minor
- Est. fire insurance / yr
- $691 – $1,283
Heat risk 4/10 · Minor
- Hot days now (above 97°F)
- 7 days/yr
- Hot days in 30 yrs
- 15 days/yr
Wind risk 4/10 · Minor
- Chance of severe wind over 30 yrs
- 12.0%
Air-quality risk 2/10 · Minimal
- Unhealthy air days now
- 1 days/yr
- Unhealthy air days in 30 yrs
- 2 days/yr
Risk factors via First Street. Map © Google.
Why this score? — see what drove the F grade
The composite is a weighted blend of 9 inputs, each scored 0–100. Each bar is that input's sub-score; the figure is the points it added to the 100-point composite (weight × sub-score).
- Schools +4.7/10.0
- ARV discount +3.4/15.0
- Livability +3.3/5.0
- Rent growth +2.5/5.0
- Condition / age +2.5/5.0
- Cash flow +0.0/30.0
- 1% rule +0.0/10.0
- DSCR +0.0/10.0
- Appreciation +0.0/10.0
$1,000,000
🖨 Deal sheet 📄 Offer letter ✓ Due diligence
Listing remarks
This is the kind of property people leave the city for — a fully realized Hudson Valley retreat where privacy, land, and lifestyle come together in a way that feels increasingly hard to find. Set across nearly 7 private acres on two separately deeded parcels, this move-in ready equestrian estate offers the freedom of country living without sacrificing convenience, with quick access to the Taconic State Parkway and an easy drive to Rhinebeck, Millbrook, Kingston, and Poughkeepsie. The home itself strikes a rare balance between warmth and sophistication. Thoughtfully updated and impeccably maintained, the interiors feel both elevated and comfortable, blending rustic textures with modern
Key facts
- Dual laundry areas
- Private entrance
- Finished lower level
Tags
Property features AI
Exterior
- Parking: Driveway; Off-street parking; 2-car garage (detached/attached not specified)
- Utilities: Electric service by Central Hudson; Septic tank; Cable connected; Electricity connected; Propane; Private trash collection
- Home design: Single-family residence; Located on a corner lot; Front yard; Landscaped grounds; Level and private lot; Waterfront lot
- Construction: Frame construction; Unfinished attic; Basement: full, partially finished, with storage space and walk-out access
- Exterior features: Fire pit; Garden; Exterior lighting; Mailbox; Playground; Rain gutters; Waterfront
Interior
- Kitchen: Dishwasher; Gas range; Microwave; Refrigerator; Stainless steel appliances; Kitchen island; Eat-in kitchen; Open kitchen
- Bedrooms: Bedroom on the first floor
- Flooring: Wood flooring
- Bathrooms: 2 full bathrooms; 1 half bathroom
- Heating & cooling: Hot water heating; Steam heating; Ductless cooling; Smart thermostat
- Interior features: First-floor bedroom; First-floor full bathroom; Ceiling fans; Double vanity; Eat-in kitchen; Entrance foyer; High-speed internet; Kitchen island; Open floorplan; Open kitchen; Primary bathroom; Recessed lighting; Smart thermostat; Storage; Walk-in closets
- Laundry & utility: Laundry room; Washer; Dryer; Laundry in multiple locations; Tankless water heater
Neighborhood map
What this means for you Summary
Snapshot
- This is a 3-bed/2.5-bath single-family listed at $1.00M.
Deal economics
- At list price, monthly cash flow is $-5k ($-55k/yr) — negative.
- To cash-flow at today's rent, offer at most $266k (73.4% below list).
- To meet the 1% rule (rent ≥ 1% of price), the offer needs to be $272k (72.8% below list).
- Recommended offer: $266k (73.4% below list) — sets the bar for cash-flow.
- Cap rate 0.8% vs local median 2.5% in Staatsburg — below-typical yield; the buyer is paying a premium for something (appreciation thesis, condition, location) that the cap rate doesn't capture.
Location & tenants
- Location reads 66/100 on livability (#639 in NY) — a middle-class / working-renter tenant base. Strengths: housing A+, employment B+; Watch: cost of living C-, amenities F, commute F.
- Hyde Park Central School District (rural): math 43% / reading 62% proficiency, ranked #316 of 590 in NY (top 54%) — acceptable for families but not a draw, mixed tenant base, ~2y average lease.
- Zoned schools: North Park Elementary School (math 37% / reading 62%, grade D, #1,085 of 2,108 statewide, top 56%, 476 students, 50% FRL); Haviland Middle School (math 23% / reading 57%, grade F, #413 of 729 statewide, top 57%, 759 students, 59% FRL); Franklin D Roosevelt Senior High School (math 93% / reading 90%, grade A+, #197 of 1,100 statewide, top 18%, 1,136 students, 52% FRL) — zoned schools average 54% FRL vs 34% district-wide (20 pts higher); higher-poverty schools than district average — tighter screening recommended.
- Market conditions: 44 active listings in the ZIP; 620 units permitted in Dutchess County in 2024 (242 in 5+ unit buildings).
Forward outlook
- Local home prices are declining (-3.0%/yr); year-one equity from $7k of loan paydown is wiped out by about $30k of value loss. Plan a longer hold.
- Dutchess County population projected at -11% by 2050 — secular population decline; favor cash flow + early exit over multi-decade hold.
Negotiation context
- It's been on market 29 days — a 2% lower offer ($985k) is reasonable based on typical stale-listing flexibility.
- Current owner paid $265k; list at $1.00M implies a 277% gain — meaningful room to come down on a strong offer.
Questions for the listing agent
- What do current leases actually rent for vs. the listed asking? Can we see a recent rent roll and the last 12 months of T-12 income?
- Built in 1973 — when were the roof, HVAC, electrical panel, plumbing, and water heater last replaced?
- Is there a deadline driving the sale (1031 exchange, divorce, estate, relocation)? That informs how much negotiation room exists.
- The area grade is low — what's the realistic commute time and amenity access for the typical tenant pool here? Any planned neighborhood developments (good or bad) we should know about?
- What's the average days-on-market for RENTAL listings here right now (not sales)? A rising rental-DOM trend means longer vacancies and softer asking-rent achievability than the comps imply.
- What's the recent tenant-quality profile in this submarket — average credit score on applications, eviction rate, late-payment / NSF rate, and stable-employment percentage? A property-management company in the area should have these aggregated.
- How much new for-sale + rental construction is in the pipeline within 1–3 miles? Heavy new supply typically softens prices + rents 12–24 months out; constrained supply supports both.
Investment metrics
- 1% rule
- 0.27% ✗
- Cap rate
- 0.75%
- Cash-on-cash
- -19.79%
- DSCR
- 0.12
- GRM
- 30.6
CMA / ARV
- ARV (on-the-fly)
- $915,980
- Comps found
- 3
Show comp detail 3 sales within ~0.75 mi
| Address | Dist | Beds/Ba | Sqft | Sold | Price | $/sf | Match |
|---|---|---|---|---|---|---|---|
| 276 Hollow Rd | 0.20mi | 3/3.0 | 2,866 (+6%) | 18mo | $829,000 | $289 | 64 |
| 20 Lauren Ln | 0.17mi | 4/2.5 (+1) | 2,322 (-14%) | 14mo | $1,300,000 | $560 | 52 |
| 30 Lauren Ln | 0.16mi | 4/3.5 (+1) | 3,107 (+15%) | 9mo | $1,050,000 | $338 | 52 |
Match score weights: distance 35% · size 25% · config 20% · recency 20%. Top-matched comps best support the ARV.
Projected returns pro-forma
-3.0% appreciation · 3.0% rent growth · sell at horizon
- IRR
- -57.2%
- Equity multiple
- -0.63×
- Total profit
- $-456,214
- Equity at exit
- $149,103
- IRR
- —
- Equity multiple
- -1.77×
- Total profit
- $-776,183
- Equity at exit
- $86,462
Cash invested: $280,000 (down + closing). Projections, not guarantees.
Landlord ↔ Tenant lean methodology
- Overall (STATE)
- 15 Strongly Tenant-Friendly
- State New York
- 15 Strongly Tenant-Friendly · D+10
- County
- — inherits STATE
- City
- — inherits STATE
ZIP-level market 12580
- Home prices YoY
- -6.7%
- Active inventory
- 44
- Price-to-rent
- 30.6×
Monthly cashflow live
- Estimated rent
- $2,722 medium interval (Pro) →
- Mortgage (P&I)
- −$5,244
- Tax from tax record
- −$1,108 /mo · $13,295/yr
- Insurance
- −$417
- HOA
- −$0
- Vacancy / Maint / Mgmt
- −$572
- Net cashflow
- $-4,618
Break-even live
UW: 25.0% down · 7.5% · 30yr · 1.5% tax · 5.0% vac · 8.0% maint · 8.0% mgmt
Financing live
Cash to close
- Down payment
- $250,000
- Closing costs
- $30,000
- Reserves months
- —
- Total cash needed
- —
Loan-product check · same deal, 3 products live
Conventional
25% down · 7.5% · 30yr
- Down + closing
- —
- Monthly P&I
- —
- Monthly cashflow
- —
- DSCR
- —
- Eligible?
- —
Personal DTI + credit; lowest rate.
DSCR
20% down · 8.5% · 30yr
- Down + closing
- —
- Monthly P&I
- —
- Monthly cashflow
- —
- DSCR
- —
- Eligible?
- —
No personal income docs; deal must DSCR.
Hard money
10% down · 12.0% · 12mo
- Down + closing
- —
- Monthly P&I
- —
- Monthly cashflow
- —
- DSCR
- —
- Eligible?
- —
Short-term bridge; refi at stabilization.
Listing history 18 events
-
2026-06-18days on market $1,000,000 Active 29 DOM
-
2026-06-17days on market $1,000,000 Active 28 DOM
-
2026-06-16days on market $1,000,000 Active 27 DOM
-
2026-06-15days on market $1,000,000 Active 26 DOM
-
2026-06-14days on market $1,000,000 Active 24 DOM
-
2026-06-10days on market $1,000,000 Active 21 DOM
-
2026-06-09days on market $1,000,000 Active 20 DOM
-
2026-06-08days on market $1,000,000 Active 19 DOM
-
2026-06-07days on market $1,000,000 Active 18 DOM
-
2026-06-03days on market $1,000,000 Active 14 DOM
-
2026-06-02days on market $1,000,000 Active 13 DOM
-
2026-06-01days on market $1,000,000 Active 12 DOM
-
2026-05-31days on market $1,000,000 Active 11 DOM
-
2026-05-30days on market $1,000,000 Active 10 DOM
-
2026-05-15$1,000,000 Active
-
2003-04-30soldstatus $265,000
-
2002-04-26soldstatus $249,000
-
1997-10-22soldstatus $149,000
ⓘ Source: listings_history table (triggers on properties + properties_extension) + one-shot
backfill from property_details.listing_events for pre-trigger history.
Tax reassessment forecast NY · Partial reset (capped growth)
- Current annual tax
- $13,295 · $1,108/mo
- Projected year-2 tax
- $15,097 · $1,258/mo
- Expected delta
- +$1,803/yr (+$150/mo · 13.6%)
ⓘ Screening estimate from a state-policy table — verify with the county assessor before closing.
Climate risk First Street
- Flood 1/10 Low FEMA zone X (unshaded) · 0% chance over 30 yrs
- Wildfire 4/10 Moderate
- Heat 4/10 Moderate 7 d/yr ≥97°F today · 15 d/yr by 30 yrs out
- Wind 4/10 Moderate 12% chance of damaging wind over 30 yrs
- Air quality 2/10 Low 1 unhealthy d/yr today · 2 by 30 yrs out
Nearby sold comps map
Loading sold comps map…
Walkable amenities ~0.75 mi
Loading nearby amenities…
Taxation est. · year 1
- Rental income
- $32,668
- − Mortgage interest
- −$56,016
- − Property taxes
- −$13,295
- − Insurance
- −$5,000
- − Repairs & maintenance
- −$2,613
- − Management
- −$2,613
- − Depreciation
- −$29,091
- Taxable loss
- −$75,960
- Est. tax savings @ 24.0%
- +$18,230
- After-tax cash flow
- $-37,186/yr
For passive investors: Depreciation is non-cash, so a rental often shows a tax loss while cash-flowing — sheltering income. Rental losses are passive: they offset passive income freely, and up to $25,000/yr can offset ordinary (W-2) income if you actively participate and your MAGI is under $100k (phasing out to $0 by $150k); unused losses carry forward. On sale, claimed depreciation is recaptured at up to 25%, and gains may owe capital-gains tax (a 1031 exchange can defer both). Figures are a year-1 estimate at your 24.0% rate — not tax advice; consult a CPA.
Schools (NCES district)
- District
- Hyde Park Central School District
- NCES district ID
- 3615180
- Math proficiency
- 43% ▼ -3.00%
- Reading proficiency
- 62% ▲ 15.00%
- Median HH income
- $68,932
- Composite
- 46.59/100
- National rank
- #2421
- State rank
- #316 of 590 in NY
Livability — Staatsburg
- Score
- 66/100
- State rank
- #639
- US rank
- #11896
Category grades
Schools grade is shown separately in the Schools card above.
Census & demographics
- Population (ZIP)
- 4,169
Population outlook (Dutchess County) Hauer SSP2
- Today (2025)
- 291,768 people
- By 2030
- 287,131 · -1.6%
- By 2040
- 274,881 · -5.8%
- By 2050
- 259,971 · -10.9%
- By 2075
- 235,366 · -19.3%
- By 2100
- 208,786 · -28.4%
Race, ethnicity, and origin ACS 2023
- Neighborhood character
- Predominantly White (84%)
- Race & ethnicity
- White 84% Two or more races 7% Black 5% Hispanic / Latino 4% Asian 2%
- Common ancestry
- Romanian 5% Lithuanian 4% Iranian 2%
- Foreign-born
- 8% · Canada
- Languages at home
- 92% English-only · Spanish 3% Other Indo-European 3% French/Haitian/Cajun 1%
Political lean MEDSL · Dutchess
- 2024 margin
- Lean D (+5.4) · D 52.7% · R 47.3%
- 2008→2024 swing
- -3.2pp toward R · 2008: 8.6pp · 2024: 5.4pp
- All cycles
- 2024: D+5.4 2020: D+9.6 2016: R+1.1 2012: D+6.6 2008: D+8.6
Not yet ingested
- Civics
- —
Market trends
- HPI YoY
- ▼ -19.18%
- Current HPI
- 269.4278
- Rent YoY
- —
- Metro
- —
- State GDP YoY
- ▲ 2.60%
- F500 in state
- 92
Industry mix (Fortune 500 HQ in NY)
| Industry | F500 HQs | Revenue |
|---|---|---|
| Financial Services | 10 | $950B |
|
||
| Consumer Goods | 9 | $162B |
|
||
| Insurance | 4 | $225B |
|
||
| Telecommunications | 2 | $144B |
|
||
| Pharmaceuticals | 2 | $112B |
|
||
| Media / Entertainment | 2 | $69B |
|
||
Price history
+571.1% since first listed4 events — show timeline
- 2026-05-15 Listed $1,000,000 OneKey® MLS as Distributed by MLS Grid
- 2003-04-30 Sold (Public Records) $265,000 Public Records
- 2002-04-26 Sold (Public Records) $249,000 Public Records
- 1997-10-22 Sold (Public Records) $149,000 Public Records
Property tax history
+7.9%/yrLatest (2025): $13,295 · +0.9% YoY. Source: county tax records.
Cash-flow waterfall
monthlySold comps — $/sqft
last 12 mo · ≤1 miLoading sold comps…