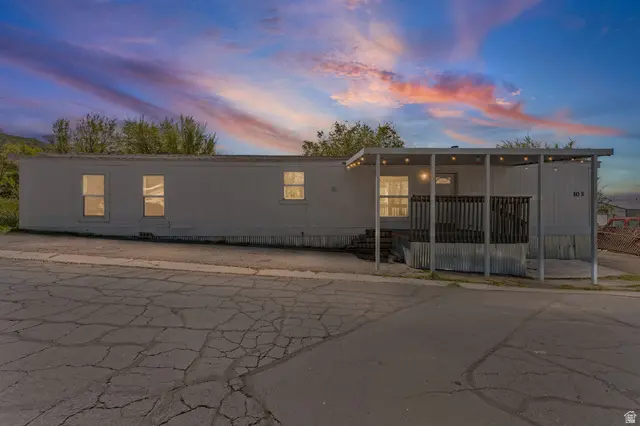
8615 N Hwy 89 N Unit 10 S
South Willard, UT 84340
$50,000D
2 bd · 2.0 ba ·
938 sqft ·
Built 1995
· SingleFamily
· Under Contract
· 24 DOM
Cashflow @ list (25.0% down · 7.5%)
Estimated rent
$1,209/mo
Mortgage (P&I)
−$262
Tax + insurance
−$83
HOA
−$650
Vac / Maint / Mgmt
−$254
Net cashflow
$-40/mo
Annual
$-482/yr
Cap rate
5.33%
Cash-on-cash
-3.44%
DSCR
0.85
1% rule
2.42%
Cash to close
$14,000
Investor read
- This is a 2-bed/2.0-bath single-family listed at $50k.
- At list price, monthly cash flow is $-40 ($-482/yr) — negative.
- To cash-flow at today's rent, offer at most $44k (11.6% below list).
- Meets the 1% rule at list price ($1k rent vs $50k).
- It's been on market 24 days — a 2% lower offer ($49k) is reasonable based on typical stale-listing flexibility.
- Recommended offer: $44k (11.6% below list) — sets the bar for cash-flow.
- Local home prices are declining (-3.0%/yr); year-one equity from $346 of loan paydown is wiped out by about $2k of value loss. Plan a longer hold.
- Location reads 68/100 on livability (#109 in UT) — a middle-class / working-renter tenant base. Strengths: crime A+, commute A+, employment A; Watch: cost of living D+, amenities F, health & safety F.
- Box Elder District (town): math 41% / reading 42% proficiency, ranked #38 of 80 in UT (top 48%) — families likely to look elsewhere, expect single-tenant / working-renter base with shorter leases.
- Zoned schools: Willard School (298 students, 24% FRL); Box Elder High (math 29% / reading 50%, grade F, #65 of 171 statewide, top 39%, 1,583 students, 23% FRL).
- Watch-outs: HOA is 54% of rent.
- Market conditions: 85 active listings in the ZIP; 461 units permitted in Box Elder County in 2024 (62 in 5+ unit buildings).
- Box Elder County population projected at +6% by 2050 — modest demand growth; plan on rents tracking national, not racing it.
- 6 sale attempts since 27y ago with the ask held roughly flat each time — persistent listings suggest the price (not the market) is what's stuck; bring a comps-based counter.
- Climate carrying-cost: major wildfire risk — expect insurance premiums to compound above CPI over the hold.
Questions for listing agent
- What do current leases actually rent for vs. the listed asking? Can we see a recent rent roll and the last 12 months of T-12 income?
- What does the HOA fee cover, when was the last increase, and are there any pending special assessments or reserve-fund shortfalls?
- Is there a deadline driving the sale (1031 exchange, divorce, estate, relocation)? That informs how much negotiation room exists.
- Schools are F-rated, which usually means shorter tenancies and higher turnover. Who's the typical renter profile here, and what's been the actual vacancy rate?
- The area grade is low — what's the realistic commute time and amenity access for the typical tenant pool here? Any planned neighborhood developments (good or bad) we should know about?
- What's the average days-on-market for RENTAL listings here right now (not sales)? A rising rental-DOM trend means longer vacancies and softer asking-rent achievability than the comps imply.
- What's the recent tenant-quality profile in this submarket — average credit score on applications, eviction rate, late-payment / NSF rate, and stable-employment percentage? A property-management company in the area should have these aggregated.
- How much new for-sale + rental construction is in the pipeline within 1–3 miles? Heavy new supply typically softens prices + rents 12–24 months out; constrained supply supports both.
CashFlowRE · CFR-DFKMKB7285EPJ4
· Data 1 week ago
cashflowre.app · 2026-05-29