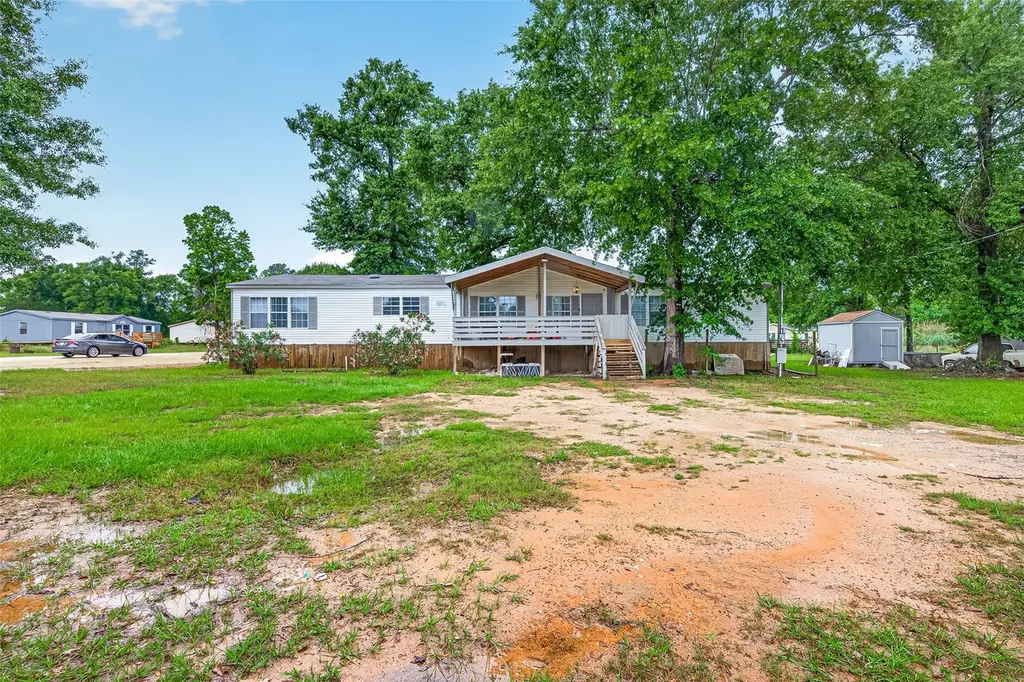
5982 Waukegan Rd
Cut and Shoot, TX 77306
$195,000B
4 bd · 2.0 ba ·
2,432 sqft ·
Built 2000
· Manufactured
· Active
· 36 DOM
Cashflow @ list (25.0% down · 7.5%)
Estimated rent
$2,216/mo
Mortgage (P&I)
−$1,023
Tax + insurance
−$142
HOA
−$30
Vac / Maint / Mgmt
−$465
Net cashflow
$556/mo
Annual
$6,667/yr
Cap rate
9.71%
Cash-on-cash
12.21%
DSCR
1.54
1% rule
1.14%
Cash to close
$54,600
Investor read
- This is a 4-bed/2.0-bath manufactured listed at $195k.
- At list price, monthly cash flow is $556 ($7k/yr) — positive.
- The deal already cash-flows at list — no discount required.
- Meets the 1% rule at list price ($2k rent vs $195k).
- It's been on market 36 days — a 3% lower offer ($189k) is reasonable based on typical stale-listing flexibility.
- Recommended offer: $189k (3.0% below list) — sets the bar for market timing.
- Local home prices are declining (-3.0%/yr); year-one equity from $1k of loan paydown is wiped out by about $6k of value loss. Plan a longer hold.
- Location reads 56/100 on livability (#1,326 in TX) — a working-class tenant base; expect higher turnover. Strengths: cost of living A+, housing A+; Watch: crime D-, amenities F, commute F.
- Conroe ISD (other): math 57% / reading 57% proficiency, ranked #69 of 826 in TX (top 8%) — acceptable for families but not a draw, mixed tenant base, ~2y average lease.
- Zoned schools: Creighton El (math 31% / reading 27%, grade F, #2,668 of 4,322 statewide, top 63%, 940 students, 92% FRL); Caney Creek H S (math 33% / reading 42%, grade F, #888 of 1,632 statewide, top 55%, 2,504 students, 79% FRL) — zoned schools average 86% FRL vs 34% district-wide (51 pts higher); higher-poverty schools than district average — tighter screening recommended.
- Zoned-school proficiency averages 33% at this address vs 57% district-wide (-24 pts) — the specific schools serving this property underperform the Conroe ISD average; the district grade overstates school quality for this exact location.
- Market conditions: 414 active listings in the ZIP; 3 comparable units currently listed for rent nearby; rentals lingering (median 44d on market — plan ~5-8 weeks vacancy on turnover, expect pricing pressure); 67% of comp listings sitting > 30 days — soft ceiling on asking rent; solid renter incomes; 13,259 units permitted in Montgomery County in 2024 (1,402 in 5+ unit buildings).
- Montgomery County population projected at +65% by 2050 — long-run rental-demand tailwind backs the buy-and-hold thesis.
- 2 sale attempts since 3y ago with the ask held roughly flat each time — persistent listings suggest the price (not the market) is what's stuck; bring a comps-based counter.
- At projected returns (-3.0% appreciation + 3.0% rent growth), your $55k cash investment doubles in ~10 years — after that, you're playing with house money.
- Climate carrying-cost: severe wind risk, 99% chance of damaging wind over 30y; major wildfire risk; extreme-heat days projected 7→25/yr by 2055 (HVAC capex compounding) — expect insurance premiums to compound above CPI over the hold.
- Cap rate 9.7% vs local median 4.8% in Cut and Shoot — top-decile yield for the area; either an underpriced asset or a hidden risk that comps aren't pricing in. Stress-test before assuming the spread holds.
- This rent runs 35% of the median local income ($76k/yr) — at the standard rent-burdened threshold; future hikes will face affordability resistance.
Questions for listing agent
- It's been on market 36 days. Have you received any prior offers? Is the seller open to a 3% concession, seller financing, or rate buy-down credit?
- What does the HOA fee cover, when was the last increase, and are there any pending special assessments or reserve-fund shortfalls?
- Is there a deadline driving the sale (1031 exchange, divorce, estate, relocation)? That informs how much negotiation room exists.
- Schools are F-rated, which usually means shorter tenancies and higher turnover. Who's the typical renter profile here, and what's been the actual vacancy rate?
- Crime grade is D in this area — have there been break-ins, vandalism, or insurance claims at this property in the last 3 years? What carrier currently insures it and at what premium?
- What's the average days-on-market for RENTAL listings here right now (not sales)? A rising rental-DOM trend means longer vacancies and softer asking-rent achievability than the comps imply.
- What's the recent tenant-quality profile in this submarket — average credit score on applications, eviction rate, late-payment / NSF rate, and stable-employment percentage? A property-management company in the area should have these aggregated.
- How much new for-sale + rental construction is in the pipeline within 1–3 miles? Heavy new supply typically softens prices + rents 12–24 months out; constrained supply supports both.
CashFlowRE · CFR-DFX2ZE6BDMKDVR
· Data 2 days ago
cashflowre.app · 2026-05-29