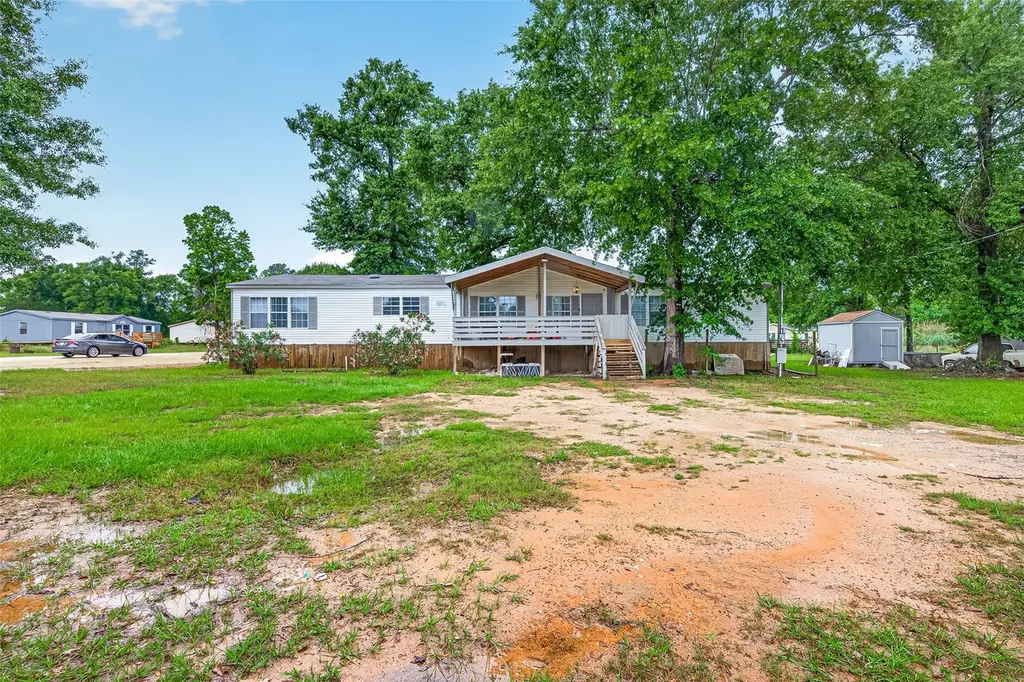
5982 Waukegan Rd · Cut and Shoot, TX
Flood risk 1/10 · Minimal
- FEMA flood zone
- X (unshaded)
- Chance of flooding over 30 yrs
- 0.0%
- Est. flood insurance / yr
- $507 – $1,088
Fire risk 6/10 · Moderate
- Est. fire insurance / yr
- $1,222 – $2,270
Heat risk 8/10 · Major
- Hot days now (above 111°F)
- 7 days/yr
- Hot days in 30 yrs
- 25 days/yr
Wind risk 8/10 · Major
- Chance of severe wind over 30 yrs
- 99.0%
Air-quality risk 2/10 · Minimal
- Unhealthy air days now
- 2 days/yr
- Unhealthy air days in 30 yrs
- 2 days/yr
Risk factors via First Street. Map © Google.
Why this score? — see what drove the B grade
The composite is a weighted blend of 9 inputs, each scored 0–100. Each bar is that input's sub-score; the figure is the points it added to the 100-point composite (weight × sub-score).
- Cash flow +27.2/30.0
- ARV discount +14.2/15.0
- DSCR +9.4/10.0
- 1% rule +6.4/10.0
- Schools +5.1/10.0
- Livability +2.8/5.0
- Rent growth +2.5/5.0
- Condition / age +2.5/5.0
- Appreciation +0.0/10.0
$195,000
🖨 Deal sheet 📄 Offer letter ✓ Due diligence
Listing remarks
Welcome home! This specious and well-maintained mobile home is nestled on a generous, good-sized lot. Enjoy relaxing on the oversized covered porch, perfect for morning coffee or evening gatherings. Inside, you'll find four bedrooms plus a versatile study that can easily serve as an additional bedroom or flex space. The primary suite offers comfort and convenience with his-and-hers closets. At the same time, the recently updated secondary bath features a modern double vanity. The kitchen includes a cozy breakfast area with a built-in table, creating the perfect spot for family meals. Outdoors, pet lovers will appreciate the fenced kennel area, ideal for furry friends.
Key facts
- Covered porch
- His-and-hers closets
- Double vanity
Tags
Property features AI
Finance
- Other:
- Financial info:
- HOA & community: Forest Trace community association; Annual association fee of $363
Exterior
- Parking:
- Security:
- Utilities: Public water; Public sewer
- Home design: Residential property; One-story (all main rooms listed on first floor)
- Construction: Built in 2000; Vinyl siding; Wood siding; Composition roof; Block foundation
- Exterior features: Porch; Cleared lot; Additional parcel(s) included
Interior
- Kitchen: Free-standing range; Oven
- Bedrooms: Primary bedroom (first floor) — 15 x 17; Bedroom (first floor) — 13 x 15; Bedroom (first floor) — 10 x 15; Bedroom (first floor) — 10 x 15
- Flooring: Carpet; Vinyl
- Bathrooms: 2 full bathrooms; Primary bathroom (first floor)
- Heating & cooling: Central heating (electric); Central air (electric)
- Interior features: Double vanity; Soaking tub; Separate shower; Vanity; Ceiling fans
- Laundry & utility: Washer hookup; Electric dryer hookup; Utility room (first floor)
Neighborhood map
What this means for you Summary
Snapshot
- This is a 4-bed/2.0-bath manufactured listed at $195k.
Deal economics
- At list price, monthly cash flow is $556 ($7k/yr) — positive.
- The deal already cash-flows at list — no discount required.
- Meets the 1% rule at list price ($2k rent vs $195k).
- Recommended offer: $189k (3.0% below list) — sets the bar for market timing.
- Cap rate 9.7% vs local median 4.8% in Cut and Shoot — top-decile yield for the area; either an underpriced asset or a hidden risk that comps aren't pricing in. Stress-test before assuming the spread holds.
Location & tenants
- Location reads 56/100 on livability (#1,326 in TX) — a working-class tenant base; expect higher turnover. Strengths: cost of living A+, housing A+; Watch: crime D-, amenities F, commute F.
- Conroe ISD (other): math 57% / reading 57% proficiency, ranked #69 of 826 in TX (top 8%) — acceptable for families but not a draw, mixed tenant base, ~2y average lease.
- Zoned schools: Creighton El (math 31% / reading 27%, grade F, #2,668 of 4,322 statewide, top 63%, 940 students, 92% FRL); Caney Creek H S (math 33% / reading 42%, grade F, #888 of 1,632 statewide, top 55%, 2,504 students, 79% FRL) — zoned schools average 86% FRL vs 34% district-wide (51 pts higher); higher-poverty schools than district average — tighter screening recommended.
- Zoned-school proficiency averages 33% at this address vs 57% district-wide (-24 pts) — the specific schools serving this property underperform the Conroe ISD average; the district grade overstates school quality for this exact location.
- Market conditions: 414 active listings in the ZIP; 3 comparable units currently listed for rent nearby; rentals lingering (median 44d on market — plan ~5-8 weeks vacancy on turnover, expect pricing pressure); 67% of comp listings sitting > 30 days — soft ceiling on asking rent; solid renter incomes; 13,259 units permitted in Montgomery County in 2024 (1,402 in 5+ unit buildings).
- This rent runs 35% of the median local income ($76k/yr) — at the standard rent-burdened threshold; future hikes will face affordability resistance.
Forward outlook
- Local home prices are declining (-3.0%/yr); year-one equity from $1k of loan paydown is wiped out by about $6k of value loss. Plan a longer hold.
- Montgomery County population projected at +65% by 2050 — long-run rental-demand tailwind backs the buy-and-hold thesis.
- At projected returns (-3.0% appreciation + 3.0% rent growth), your $55k cash investment doubles in ~10 years — after that, you're playing with house money.
Negotiation context
- It's been on market 36 days — a 3% lower offer ($189k) is reasonable based on typical stale-listing flexibility.
- 2 sale attempts since 3y ago with the ask held roughly flat each time — persistent listings suggest the price (not the market) is what's stuck; bring a comps-based counter.
Risks & watch-outs
- Climate carrying-cost: severe wind risk, 99% chance of damaging wind over 30y; major wildfire risk; extreme-heat days projected 7→25/yr by 2055 (HVAC capex compounding) — expect insurance premiums to compound above CPI over the hold.
Questions for the listing agent
- It's been on market 36 days. Have you received any prior offers? Is the seller open to a 3% concession, seller financing, or rate buy-down credit?
- What does the HOA fee cover, when was the last increase, and are there any pending special assessments or reserve-fund shortfalls?
- Is there a deadline driving the sale (1031 exchange, divorce, estate, relocation)? That informs how much negotiation room exists.
- Schools are F-rated, which usually means shorter tenancies and higher turnover. Who's the typical renter profile here, and what's been the actual vacancy rate?
- Crime grade is D in this area — have there been break-ins, vandalism, or insurance claims at this property in the last 3 years? What carrier currently insures it and at what premium?
- What's the average days-on-market for RENTAL listings here right now (not sales)? A rising rental-DOM trend means longer vacancies and softer asking-rent achievability than the comps imply.
- What's the recent tenant-quality profile in this submarket — average credit score on applications, eviction rate, late-payment / NSF rate, and stable-employment percentage? A property-management company in the area should have these aggregated.
- How much new for-sale + rental construction is in the pipeline within 1–3 miles? Heavy new supply typically softens prices + rents 12–24 months out; constrained supply supports both.
Investment metrics
- 1% rule
- 1.14% ✓
- Cap rate
- 9.71%
- Cash-on-cash
- 12.21%
- DSCR
- 1.54
- GRM
- 7.3
CMA / ARV
- ARV (median comp)
- $229,000
- List price
- $195,000
- Delta
- -14.85%
- Verdict
- UNDERPRICED
- Comps
- 3 within 2.0 mi
Show comp detail 1 sale within ~0.75 mi
| Address | Dist | Beds/Ba | Sqft | Sold | Price | $/sf | Match |
|---|---|---|---|---|---|---|---|
| 7126 Jessica Leann Dr | 0.44mi | 4/2.0 | 2,128 (-12%) | 5mo | $175,000 | $82 | 54 |
Match score weights: distance 35% · size 25% · config 20% · recency 20%. Top-matched comps best support the ARV.
Projected returns pro-forma
-3.0% appreciation · 3.0% rent growth · sell at horizon
- IRR
- 1.8%
- Equity multiple
- 1.07×
- Total profit
- $3,725
- Equity at exit
- $29,075
- IRR
- 11.4%
- Equity multiple
- 1.89×
- Total profit
- $48,561
- Equity at exit
- $16,860
Cash invested: $54,600 (down + closing). Projections, not guarantees.
Landlord ↔ Tenant lean methodology
- Overall (STATE)
- 87 Strongly Landlord-Friendly
- State Texas
- 87 Strongly Landlord-Friendly · R+5
- County
- — inherits STATE
- City
- — inherits STATE
ZIP-level market 77306
- Home prices YoY
- -4.1%
- Active inventory
- 414
- Price-to-rent
- 7.3×
Monthly cashflow live
- Estimated rent
- $2,216 medium interval (Pro) →
- Mortgage (P&I)
- −$1,023
- Tax from tax record
- −$61 /mo · $733/yr
- Insurance
- −$81
- HOA
- −$30
- Vacancy / Maint / Mgmt
- −$465
- Net cashflow
- $556
Break-even live
UW: 25.0% down · 7.5% · 30yr · 1.5% tax · 5.0% vac · 8.0% maint · 8.0% mgmt
Financing live
Cash to close
- Down payment
- $48,750
- Closing costs
- $5,850
- Reserves months
- —
- Total cash needed
- —
Loan-product check · same deal, 3 products live
Conventional
25% down · 7.5% · 30yr
- Down + closing
- —
- Monthly P&I
- —
- Monthly cashflow
- —
- DSCR
- —
- Eligible?
- —
Personal DTI + credit; lowest rate.
DSCR
20% down · 8.5% · 30yr
- Down + closing
- —
- Monthly P&I
- —
- Monthly cashflow
- —
- DSCR
- —
- Eligible?
- —
No personal income docs; deal must DSCR.
Hard money
10% down · 12.0% · 12mo
- Down + closing
- —
- Monthly P&I
- —
- Monthly cashflow
- —
- DSCR
- —
- Eligible?
- —
Short-term bridge; refi at stabilization.
Rent comps 3 comps
| Address | Beds | Baths | Sqft | Rent | $/sqft | DOM | Units | Dist |
|---|---|---|---|---|---|---|---|---|
| 14990 N Ascot Bend Cir Conroe, TX | 4.0 | 2.0 | 1607 | $2,400 | $1.49 | 43d | 1 | 0.61mi |
| 15141 Meadow Gln S Conroe, TX | 3.0 | 3.0 | 1864 | $1,961 | $1.05 | 22d | 1 | 0.66mi |
| 14918 N Ascot Bend Cir Conroe, TX | 4.0 | 2.5 | 1979 | $1,955 | $0.99 | 43d | 1 | 0.67mi |
HOA detail
- Monthly dues
- $30 · $360/yr
Listing history 16 events
-
2026-06-18days on market $195,000 Active 36 DOM
-
2026-06-17days on market $195,000 Active 35 DOM
-
2026-06-16days on market $195,000 Active 34 DOM
-
2026-06-15days on market $195,000 Active 33 DOM
-
2026-06-13days on market $195,000 Active 31 DOM
-
2026-06-09days on market $195,000 Active 27 DOM
-
2026-06-08days on market $195,000 Active 26 DOM
-
2026-06-07days on market $195,000 Active 25 DOM
-
2026-06-04days on market $195,000 Active 22 DOM
-
2026-06-03days on market $195,000 Active 21 DOM
-
2026-06-02days on market $195,000 Active 20 DOM
-
2026-06-01days on market $195,000 Active 19 DOM
-
2026-05-31days on market $195,000 Active 18 DOM
-
2026-05-13$195,000 Active 676-char remark
-
2023-12-31historical $1,650
-
2023-11-23$1,650
ⓘ Source: listings_history table (triggers on properties + properties_extension) + one-shot
backfill from property_details.listing_events for pre-trigger history.
Tax reassessment forecast TX · Resets to sale price
- Current annual tax
- $733 · $61/mo
- Projected year-2 tax
- $3,568 · $297/mo
- Expected delta
- +$2,835/yr (+$236/mo · 386.6%)
ⓘ Screening estimate from a state-policy table — verify with the county assessor before closing.
Climate risk First Street
- Flood 1/10 Low FEMA zone X (unshaded) · 0% chance over 30 yrs
- Wildfire 6/10 Major
- Heat 8/10 Severe 7 d/yr ≥111°F today · 25 d/yr by 30 yrs out
- Wind 8/10 Severe 99% chance of damaging wind over 30 yrs
- Air quality 2/10 Low 2 unhealthy d/yr today · 2 by 30 yrs out
Nearby sold comps map
Loading sold comps map…
Walkable amenities ~0.75 mi
Loading nearby amenities…
Taxation est. · year 1
- Rental income
- $26,590
- − Mortgage interest
- −$10,923
- − Property taxes
- −$733
- − Insurance
- −$975
- − Repairs & maintenance
- −$2,127
- − Management
- −$2,127
- − HOA
- −$360
- − Depreciation
- −$5,673
- Taxable income
- $3,672
- Est. tax owed @ 24.0%
- −$881
- After-tax cash flow
- $5,786/yr
For passive investors: Depreciation is non-cash, so a rental often shows a tax loss while cash-flowing — sheltering income. Rental losses are passive: they offset passive income freely, and up to $25,000/yr can offset ordinary (W-2) income if you actively participate and your MAGI is under $100k (phasing out to $0 by $150k); unused losses carry forward. On sale, claimed depreciation is recaptured at up to 25%, and gains may owe capital-gains tax (a 1031 exchange can defer both). Figures are a year-1 estimate at your 24.0% rate — not tax advice; consult a CPA.
Schools (NCES district)
- District
- Conroe ISD
- NCES district ID
- 4815000
- Math proficiency
- 57% ▼ -6.00%
- Reading proficiency
- 57% ▼ -1.00%
- Median HH income
- $71,541
- Composite
- 50.65/100
- National rank
- #1833
- State rank
- #69 of 826 in TX
Livability — Cut and Shoot
- Score
- 56/100
- State rank
- #1326
- US rank
- #22835
Category grades
Schools grade is shown separately in the Schools card above.
Census & demographics
- County
- Montgomery County · 663,713 people
- Metro
- Houston-The Woodlands-Sugar Land, TX
- Population (ZIP)
- 18,086
- Household income
- $76,257
- Rent vs Own
- Severe rent burden
- 231.0
Population outlook (Montgomery County) Hauer SSP2
- Today (2025)
- 713,896 people
- By 2030
- 805,263 · +12.8%
- By 2040
- 992,708 · +39.1%
- By 2050
- 1,179,590 · +65.2%
- By 2075
- 1,628,084 · +128.1%
- By 2100
- 1,937,880 · +171.5%
Race, ethnicity, and origin ACS 2023
- Neighborhood character
- Majority Hispanic (55%)
- Race & ethnicity
- Hispanic / Latino 55% White 41% Two or more races 11% Black 2%
- Hispanic origin (detail)
- Mexican 51%
- Common ancestry
- Iranian 1% Slovak 1% Lithuanian 1%
- Foreign-born
- 21% · Canada
- Languages at home
- 53% English-only · Spanish 45% German/W. Germanic 1%
Political lean MEDSL · Montgomery
- 2024 margin
- Solid R (+45.5) · D 26.8% · R 72.3%
- 2008→2024 swing
- +7.2pp toward D · 2008: -52.7pp · 2024: -45.5pp
- All cycles
- 2024: R+45.5 2020: R+43.8 2016: R+51.4 2012: R+60.7 2008: R+52.7
Not yet ingested
- Civics
- —
Market trends
- HPI YoY
- ▼ -13.02%
- Current HPI
- 306.3801
- Rent YoY
- —
- Metro
- Houston-The Woodlands-Sugar Land, TX
- State GDP YoY
- ▲ 3.95%
- F500 in state
- 110
Industry mix (Fortune 500 HQ in TX)
| Industry | F500 HQs | Revenue |
|---|---|---|
| Energy | 16 | $1,198B |
|
||
| Technology | 5 | $198B |
|
||
| Engineering / Construction | 4 | $72B |
|
||
| Energy Services | 3 | $60B |
|
||
| Utilities | 3 | $41B |
|
||
| Healthcare | 2 | $330B |
|
||
Price history
+11718.2% since first listed3 events — show timeline
- 2026-05-13 Listed $195,000 HARMLS
- 2023-12-31 Rental Removed $1,650 HARMLS
- 2023-11-23 Listed for Rent $1,650 HARMLS
Property tax history
-2.1%/yrLatest (2025): $733 · +19.5% YoY. Source: county tax records.
Cash-flow waterfall
monthlySold comps — $/sqft
last 12 mo · ≤1 miLoading sold comps…