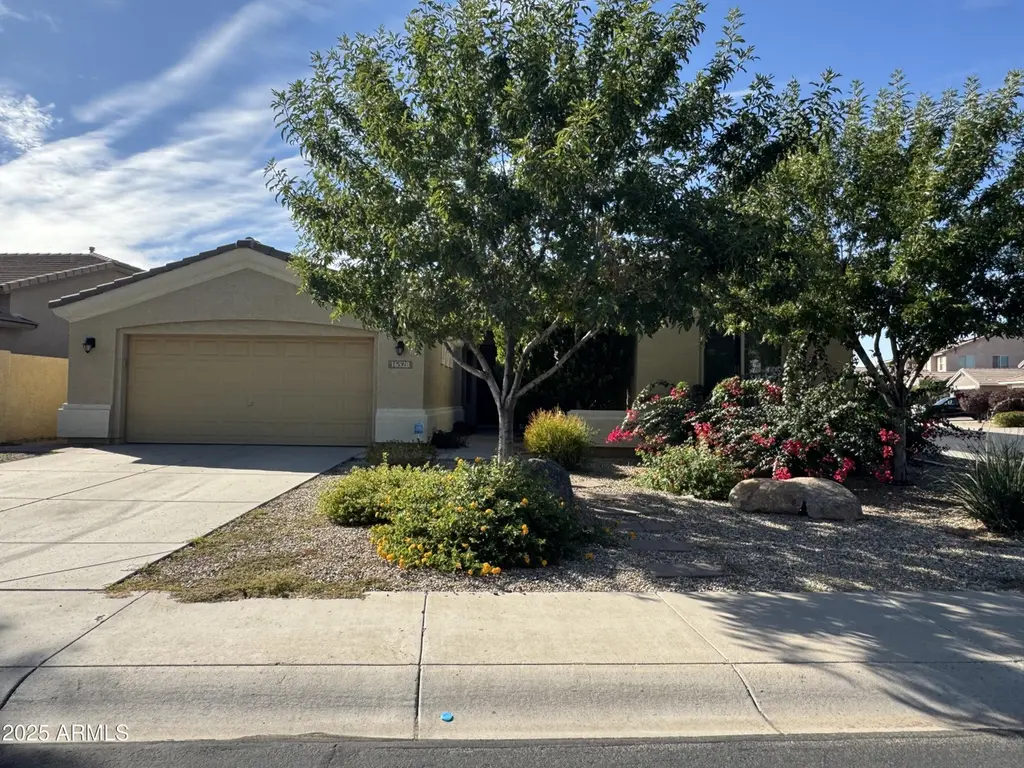
16528 N 181st Dr
Surprise, AZ 85388
$410,000D-
4 bd · 3.0 ba ·
2,210 sqft ·
Built 2014
· SingleFamily
· Pending
· 131 DOM
Cashflow @ list (25.0% down · 7.5%)
Estimated rent
$2,555/mo
Mortgage (P&I)
−$2,150
Tax + insurance
−$325
HOA
−$79
Vac / Maint / Mgmt
−$537
Net cashflow
$-535/mo
Annual
$-6,421/yr
Cap rate
4.73%
Cash-on-cash
-5.59%
DSCR
0.75
1% rule
0.62%
Cash to close
$114,800
Investor read
- This is a 4-bed/3.0-bath single-family listed at $410k.
- At list price, monthly cash flow is $-535 ($-6k/yr) — negative.
- To cash-flow at today's rent, offer at most $315k (23.1% below list).
- To meet the 1% rule (rent ≥ 1% of price), the offer needs to be $256k (37.7% below list).
- It's been on market 131 days — a 12% lower offer ($361k) is reasonable based on typical stale-listing flexibility.
- Recommended offer: $256k (37.7% below list) — sets the bar for 1% rule.
- In year one you build about $4k of equity ($3k loan paydown + $1k appreciation (0.3% local appreciation)).
- Location reads 74/100 on livability (#19 in AZ, #4,616 nationally) — a middle-class / working-renter tenant base. Strengths: crime A+, housing A+, employment A-; Watch: health & safety D+, amenities D-, commute F.
- Dysart Unified District (4243) (suburban): math 34% / reading 40% proficiency, ranked #73 of 249 in AZ (top 29%) — families likely to look elsewhere, expect single-tenant / working-renter base with shorter leases.
- Market conditions: Rents soft (-0.6%/yr); 376 active listings in the ZIP; 40 comparable units currently listed for rent nearby; rentals at typical pace (median 25d on market — plan ~3-4 weeks tenant-placement turnaround); 40% of comp listings sitting > 30 days — soft ceiling on asking rent; high-income renter base; 36,011 units permitted in Maricopa County in 2024 (12,801 in 5+ unit buildings).
- Maricopa County population projected at +38% by 2050 — long-run rental-demand tailwind backs the buy-and-hold thesis.
- 10 sale attempts since 8y ago; this cycle's ask has dropped $40k (9%) from the opening price — seller is motivated, your offer sets the floor, not the list.
- By year 7, paydown + projected appreciation supports a ~$31k cash-out refi (75% LTV) — recoverable capital for the next deal without selling this one.
- Climate carrying-cost: moderate wildfire risk; extreme-heat days projected 7→17/yr by 2055 (HVAC capex compounding) — expect insurance premiums to compound above CPI over the hold.
- Cap rate 4.7% vs local median 3.3% in Surprise — top-decile yield for the area; either an underpriced asset or a hidden risk that comps aren't pricing in. Stress-test before assuming the spread holds.
Questions for listing agent
- What do current leases actually rent for vs. the listed asking? Can we see a recent rent roll and the last 12 months of T-12 income?
- It's been on market 131 days. Have you received any prior offers? Is the seller open to a 38% concession, seller financing, or rate buy-down credit?
- What does the HOA fee cover, when was the last increase, and are there any pending special assessments or reserve-fund shortfalls?
- Why hasn't it sold? Are there any deal-killer items the seller is aware of (foundation, flood, title, zoning, code violations)?
- Is there a deadline driving the sale (1031 exchange, divorce, estate, relocation)? That informs how much negotiation room exists.
- The area grade is low — what's the realistic commute time and amenity access for the typical tenant pool here? Any planned neighborhood developments (good or bad) we should know about?
- What's the average days-on-market for RENTAL listings here right now (not sales)? A rising rental-DOM trend means longer vacancies and softer asking-rent achievability than the comps imply.
- What's the recent tenant-quality profile in this submarket — average credit score on applications, eviction rate, late-payment / NSF rate, and stable-employment percentage? A property-management company in the area should have these aggregated.
CashFlowRE · CFR-DHV24S8CEB2NAF
· Data 3 weeks ago
cashflowre.app · 2026-05-29