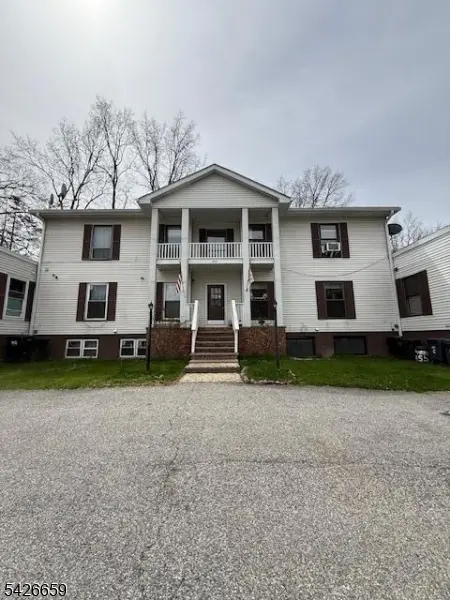
355 Lake Shr S Unit F
Milford, PA 07827
$175,000B
3 bd · 2.0 ba ·
1,835 sqft ·
Built 1973
· Condo
· Under Contract
· 19 DOM
Cashflow @ list (25.0% down · 7.5%)
Estimated rent
$2,256/mo
Mortgage (P&I)
−$918
Tax + insurance
−$292
HOA
−$123
Vac / Maint / Mgmt
−$474
Net cashflow
$450/mo
Annual
$5,402/yr
Cap rate
9.38%
Cash-on-cash
11.02%
DSCR
1.49
1% rule
1.29%
Cash to close
$49,000
Investor read
- This is a 3-bed/2.0-bath condo listed at $175k. Condition is rated fair.
- At list price, monthly cash flow is $450 ($5k/yr) — positive.
- The deal already cash-flows at list — no discount required.
- Meets the 1% rule at list price ($2k rent vs $175k).
- It's been on market 19 days — a 2% lower offer ($172k) is reasonable based on typical stale-listing flexibility.
- Recommended offer: $172k (1.5% below list) — sets the bar for market timing.
- Local home prices are declining (-3.0%/yr); year-one equity from $1k of loan paydown is wiped out by about $5k of value loss. Plan a longer hold.
- Location reads 79/100 on livability (#255 in PA, #2,230 nationally) — a middle-class / working-renter tenant base. Strengths: crime A+, amenities A+, health & safety A+; Watch: cost of living D+, commute F.
- Montague Township School District (rural): math 40% / reading 55% proficiency, ranked #400 of 612 in NJ (top 65%) — families likely to look elsewhere, expect single-tenant / working-renter base with shorter leases.
- Zoned schools: Montague Township School (math 12% / reading 37%, grade F, #878 of 1,303 statewide, top 70%, 310 students, 32% FRL) — zoned schools at 32% FRL track the district average.
- Zoned-school proficiency averages 24% at this address vs 48% district-wide (-23 pts) — the specific schools serving this property underperform the Montague Township School District average; the district grade overstates school quality for this exact location.
- Market conditions: 184 units permitted in Sussex County in 2024 (18 in 5+ unit buildings).
- Sussex County population projected at -25% by 2050 — secular population decline; favor cash flow + early exit over multi-decade hold.
- At projected returns (-3.0% appreciation + 3.0% rent growth), your $49k cash investment doubles in ~10 years — after that, you're playing with house money.
- Cap rate 9.4% vs local median 2.4% in Milford — top-decile yield for the area; either an underpriced asset or a hidden risk that comps aren't pricing in. Stress-test before assuming the spread holds.
Questions for listing agent
- Have any recent inspections been done? Can we get a copy of the seller's disclosures and any deferred-maintenance estimates?
- Built in 1973 — when were the roof, HVAC, electrical panel, plumbing, and water heater last replaced?
- What does the HOA fee cover, when was the last increase, and are there any pending special assessments or reserve-fund shortfalls?
- Any open or pending special assessments — roof, HVAC, plumbing, elevator, façade? What's the per-unit balance and payoff schedule, and is the seller paying it off at close or rolling it to the buyer?
- Is there a deadline driving the sale (1031 exchange, divorce, estate, relocation)? That informs how much negotiation room exists.
- Schools are B-rated — typically a magnet for longer-tenancy family renters. What's the average tenant stay here, and is there a school-zone premium baked into asking?
- What's the average days-on-market for RENTAL listings here right now (not sales)? A rising rental-DOM trend means longer vacancies and softer asking-rent achievability than the comps imply.
- What's the recent tenant-quality profile in this submarket — average credit score on applications, eviction rate, late-payment / NSF rate, and stable-employment percentage? A property-management company in the area should have these aggregated.
Repairs flagged (vision-AI assessment)
- Major: siding — Significant wear and tear
- Major: landscaping — Overgrown and unkempt
- Major: carpet — Worn and in need of replacement
CashFlowRE · CFR-DJ5EKEAZ3W1D1V
· Data 3 days ago
cashflowre.app · 2026-05-29