355 Lake Shr S Unit F · Milford, PA
Flood risk No data
- FEMA flood zone
- —
- Chance of flooding over 30 yrs
- —
- Est. flood insurance / yr
- —
Fire risk No data
- Est. fire insurance / yr
- —
Heat risk No data
- Hot days now (above threshold)
- —
- Hot days in 30 yrs
- —
Wind risk No data
- Chance of severe wind over 30 yrs
- —
Air-quality risk No data
- Unhealthy air days now
- —
- Unhealthy air days in 30 yrs
- —
Risk factors via First Street. Map © Google.
Why this score? — see what drove the B grade
The composite is a weighted blend of 9 inputs, each scored 0–100. Each bar is that input's sub-score; the figure is the points it added to the 100-point composite (weight × sub-score).
- Cash flow +26.3/30.0
- ARV discount +15.0/15.0
- DSCR +8.9/10.0
- 1% rule +7.9/10.0
- Schools +4.4/10.0
- Livability +4.0/5.0
- Rent growth +2.5/5.0
- Condition / age +2.2/5.0
- Appreciation +1.1/10.0
$175,000
🖨 Deal sheet (PDF) 📄 Offer letter ✓ Due diligence
Listing remarks
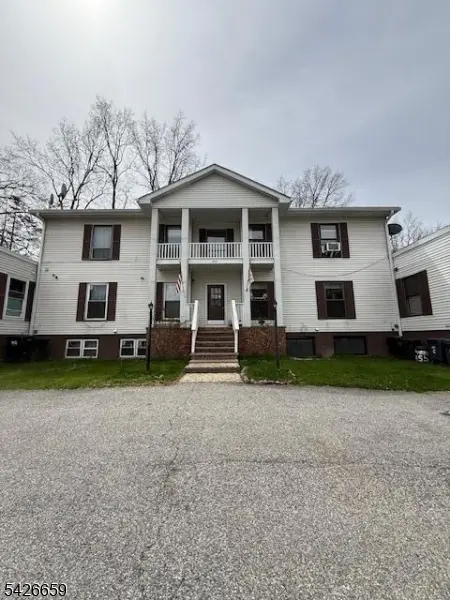
Welcome to a spacious opportunity in beautiful High Point Country Club. This home offers substantial space and great potential for someone ready to roll up their sleeves and work with TLC to make it shine. This residence features a very large living room that flows seamlessly into the kitchen, a separate dining area perfect for entertaining, and two bedrooms on the main level accompanied by a full bathroom. The second floor is reserved for a humongous primary suite, complete with its own full bathroom and two walk-in closets, delivering a private retreat within the home. The total square footage is 1,835 sq ft, providing abundant space to reimagine and personalize. The layout invites flexib
Key facts
- $123 HOA
- 2 parking spots
- Community pool
Property features AI
Finance
- HOA & community: Monthly association fee of $123; Association fee covers common area maintenance; Pets allowed; Community living
Exterior
- Parking: Assigned parking (2 spaces)
- Utilities: Electric service; Public water; Septic system
- Home design: Multi-floor unit; Approximately 2 floors; Entry faces not specified
- Construction: Approximate year built; Asphalt shingle roof
- Exterior features: Association outdoor pool; Lake privileges; Tennis courts; Vinyl siding; Blacktop assigned driveway
Interior
- Kitchen: Refrigerator
- Bedrooms: Two bedrooms on main level; One bedroom on upper level
- Bathrooms: Two full bathrooms
- Heating & cooling: Electric baseboard heating; Window air conditioners
- Interior features: Refrigerator included; Separate dining area; Formal dining room
Neighborhood map
What this means for you Summary
Snapshot
- This is a 3-bed/2.0-bath condo listed at $175k. Condition is rated fair.
Deal economics
- At list price, monthly cash flow is $450 ($5k/yr) — positive.
- The deal already cash-flows at list — no discount required.
- Meets the 1% rule at list price ($2k rent vs $175k).
- Recommended offer: $172k (1.5% below list) — sets the bar for market timing.
- Cap rate 9.4% vs local median 2.4% in Milford — top-decile yield for the area; either an underpriced asset or a hidden risk that comps aren't pricing in. Stress-test before assuming the spread holds.
Location & tenants
- Location reads 79/100 on livability (#255 in PA, #2,230 nationally) — a middle-class / working-renter tenant base. Strengths: crime A+, amenities A+, health & safety A+; Watch: cost of living D+, commute F.
- Montague Township School District (rural): math 40% / reading 55% proficiency, ranked #400 of 612 in NJ (top 65%) — families likely to look elsewhere, expect single-tenant / working-renter base with shorter leases.
- Zoned schools: Montague Township School (math 12% / reading 37%, grade F, #878 of 1,303 statewide, top 70%, 310 students, 32% FRL) — zoned schools at 32% FRL track the district average.
- Zoned-school proficiency averages 24% at this address vs 48% district-wide (-23 pts) — the specific schools serving this property underperform the Montague Township School District average; the district grade overstates school quality for this exact location.
- Market conditions: 184 units permitted in Sussex County in 2024 (18 in 5+ unit buildings).
Forward outlook
- Local home prices are declining (-3.0%/yr); year-one equity from $1k of loan paydown is wiped out by about $5k of value loss. Plan a longer hold.
- Sussex County population projected at -25% by 2050 — secular population decline; favor cash flow + early exit over multi-decade hold.
- At projected returns (-3.0% appreciation + 3.0% rent growth), your $49k cash investment doubles in ~10 years — after that, you're playing with house money.
Negotiation context
- It's been on market 19 days — a 2% lower offer ($172k) is reasonable based on typical stale-listing flexibility.
Questions for the listing agent
- Have any recent inspections been done? Can we get a copy of the seller's disclosures and any deferred-maintenance estimates?
- Built in 1973 — when were the roof, HVAC, electrical panel, plumbing, and water heater last replaced?
- What does the HOA fee cover, when was the last increase, and are there any pending special assessments or reserve-fund shortfalls?
- Any open or pending special assessments — roof, HVAC, plumbing, elevator, façade? What's the per-unit balance and payoff schedule, and is the seller paying it off at close or rolling it to the buyer?
- Is there a deadline driving the sale (1031 exchange, divorce, estate, relocation)? That informs how much negotiation room exists.
- Schools are B-rated — typically a magnet for longer-tenancy family renters. What's the average tenant stay here, and is there a school-zone premium baked into asking?
- What's the average days-on-market for RENTAL listings here right now (not sales)? A rising rental-DOM trend means longer vacancies and softer asking-rent achievability than the comps imply.
- What's the recent tenant-quality profile in this submarket — average credit score on applications, eviction rate, late-payment / NSF rate, and stable-employment percentage? A property-management company in the area should have these aggregated.
- How much new apartment / multifamily construction is in the pipeline within 1–3 miles? Heavy new supply (>2% of stock underway) typically softens rents 12–24 months out; light construction supports rent growth.
Investment metrics
- 1% rule
- 1.29% ✓
- Cap rate
- 9.38%
- Cash-on-cash
- 11.02%
- DSCR
- 1.49
- GRM
- 6.5
CMA / ARV
- ARV (median comp)
- $312,206
- List price
- $175,000
- Delta
- -43.95%
- Verdict
- UNDERPRICED
- Comps
- 2 within 1.0 mi
Projected returns pro-forma
-3.0% appreciation · 3.0% rent growth · sell at horizon
- IRR
- 0.2%
- Equity multiple
- 1.01×
- Total profit
- $422
- Equity at exit
- $26,093
- IRR
- 9.9%
- Equity multiple
- 1.77×
- Total profit
- $37,730
- Equity at exit
- $15,131
Cash invested: $49,000 (down + closing). Projections, not guarantees.
Landlord ↔ Tenant lean methodology
- Overall (STATE)
- 62 Landlord-Friendly
- State Pennsylvania
- 62 Landlord-Friendly · EVEN
- County
- — inherits STATE
- City
- — inherits STATE
ZIP-level market 07827
- Home prices YoY
- -2.6%
- Price-to-rent
- 6.5×
Monthly cashflow live
- Estimated rent
- $2,256 medium interval (Pro) →
- Mortgage (P&I)
- −$918
- Tax est. 1.5%
- −$219 /mo · $2,625/yr
- Insurance
- −$73
- HOA
- −$123
- Vacancy / Maint / Mgmt
- −$474
- Net cashflow
- $450
Break-even live
Sensitivity live
| Price | -10% $571 | -5% $511 | +0% $450 | +5% $390 | +10% $329 |
|---|---|---|---|---|---|
| Rent | -10% $272 | -5% $361 | +0% $450 | +5% $539 | +10% $628 |
| Rate | -1.0pp $538 | -0.5pp $495 | base $450 | +0.5pp $405 | +1.0pp $359 |
UW: 25.0% down · 7.5% · 30yr · 1.5% tax · 5.0% vac · 8.0% maint · 8.0% mgmt
Financing live
Cash to close
- Down payment
- $43,750
- Closing costs
- $5,250
- Reserves months
- —
- Total cash needed
- —
Loan-product check · same deal, 3 products live
Conventional
25% down · 7.5% · 30yr
- Down + closing
- —
- Monthly P&I
- —
- Monthly cashflow
- —
- DSCR
- —
- Eligible?
- —
Personal DTI + credit; lowest rate.
DSCR
20% down · 8.5% · 30yr
- Down + closing
- —
- Monthly P&I
- —
- Monthly cashflow
- —
- DSCR
- —
- Eligible?
- —
No personal income docs; deal must DSCR.
Hard money
10% down · 12.0% · 12mo
- Down + closing
- —
- Monthly P&I
- —
- Monthly cashflow
- —
- DSCR
- —
- Eligible?
- —
Short-term bridge; refi at stabilization.
HOA detail condo
- Monthly dues
- $123 · $1,476/yr
- Assessments
- None detected in remarks — confirm with the listing agent.
Listing history 1 events
-
2026-04-30$175,000 Active 1443-char remark
ⓘ Source: listings_history table (triggers on properties + properties_extension) + one-shot
backfill from property_details.listing_events for pre-trigger history.
Nearby sold comps map
Loading sold comps map…
Walkable amenities ~0.75 mi
Loading nearby amenities…
Taxation est. · year 1
- Rental income
- $27,076
- − Mortgage interest
- −$9,803
- − Property taxes
- −$2,625
- − Insurance
- −$875
- − Repairs & maintenance
- −$2,166
- − Management
- −$2,166
- − HOA
- −$1,476
- − Depreciation
- −$5,091
- Taxable income
- $2,875
- Est. tax owed @ 24.0%
- −$690
- After-tax cash flow
- $4,712/yr
For passive investors: Depreciation is non-cash, so a rental often shows a tax loss while cash-flowing — sheltering income. Rental losses are passive: they offset passive income freely, and up to $25,000/yr can offset ordinary (W-2) income if you actively participate and your MAGI is under $100k (phasing out to $0 by $150k); unused losses carry forward. On sale, claimed depreciation is recaptured at up to 25%, and gains may owe capital-gains tax (a 1031 exchange can defer both). Figures are a year-1 estimate at your 24.0% rate — not tax advice; consult a CPA.
Condition & rehab AI · 6 photos
This property requires moderate renovations, including exterior repairs and landscaping, to improve its curb appeal and resale value.
Repairs flagged
- Major siding — Significant wear and tear
- Major landscaping — Overgrown and unkempt
- Major carpet — Worn and in need of replacement
Value-add opportunities
- Resale paint exterior — Fresh paint enhances curb appeal
- Resale landscaping — Well-maintained landscaping improves curb appeal
- Both replace carpet — New carpet improves comfort and aesthetics
Renovation cost estimate screening
| Repair item | Severity | Est. cost |
|---|---|---|
| siding · Significant wear and tear | Major | $15,000–50,000 |
| landscaping · Overgrown and unkempt | Major | $15,000–50,000 |
| carpet · Worn and in need of replacement | Major | $15,000–50,000 |
| Total estimated repair cost · 3 items | $45,000–150,000 |
Value-add ROI direction
- Resale paint exterior — Fresh paint enhances curb appeal ↑
- Resale landscaping — Well-maintained landscaping improves curb appeal ↑
- Both replace carpet — New carpet improves comfort and aesthetics ↑
ⓘ Cost ranges are severity-bucket heuristics (US national rule-of-thumb). Get contractor quotes + a written scope before underwriting a rehab budget.
Schools (NCES district)
- District
- Montague Township School District
- NCES district ID
- 3410530
- Math proficiency
- 40% ▼ -15.00%
- Reading proficiency
- 55% ▬ 0.00%
- Median HH income
- $62,366
- Composite
- 43.98/100
- National rank
- #6267
- State rank
- #400 of 612 in NJ
Livability — Milford
- Score
- 79/100
- State rank
- #255
- US rank
- #2230
Category grades
Schools grade is shown separately in the Schools card above.
Census & demographics
- City population
- 15,799
- Population (ZIP)
- 4,111
Population outlook (Sussex County) Hauer SSP2
- Today (2025)
- 133,413 people
- By 2030
- 127,324 · -4.6%
- By 2040
- 113,987 · -14.6%
- By 2050
- 100,391 · -24.8%
- By 2075
- 78,063 · -41.5%
- By 2100
- 62,346 · -53.3%
Race, ethnicity, and origin ACS 2023
- Neighborhood character
- Predominantly White (85%)
- Race & ethnicity
- White 85% Two or more races 6% Asian 6% Hispanic / Latino 5%
- Hispanic origin (detail)
- Mexican 1%
- Common ancestry
- Romanian 9% Iranian 4% Subsaharan African 2%
- Foreign-born
- 6% · Canada, China, Dominican Republic
- Languages at home
- 92% English-only · Spanish 3% Other Indo-European 2% Russian/Polish/Slavic 2%
Political lean MEDSL · Sussex
- 2024 margin
- Strong R (+24.9) · D 36.6% · R 61.6% · Other 1.8%
- 2008→2024 swing
- -4.2pp toward R · 2008: -20.7pp · 2024: -24.9pp
- All cycles
- 2024: R+24.9 2020: R+19.5 2016: R+30.3 2012: R+22.4 2008: R+20.7
Not yet ingested
- Civics
- —
Market trends
- HPI YoY
- ▼ -7.89%
- Current HPI
- 290.6237
- Rent YoY
- —
- Metro
- —
- State GDP YoY
- ▲ 1.68%
- F500 in state
- 34
Industry mix (Fortune 500 HQ in PA)
| Industry | F500 HQs | Revenue |
|---|---|---|
| Healthcare | 2 | $309B |
|
||
| Insurance | 2 | $27B |
|
||
| Telecommunications / Media | 1 | $124B |
|
||
| Industrial Distribution | 1 | $22B |
|
||
| Financial Services | 1 | $20B |
|
||
| Chemicals / Materials | 1 | $18B |
|
||
Price history
2 events — show timeline
- 2026-05-19 Pending — GSMLS
- 2026-04-30 Listed $175,000 GSMLS
Cash-flow waterfall
monthlySold comps — $/sqft
last 12 mo · ≤1 miLoading sold comps…