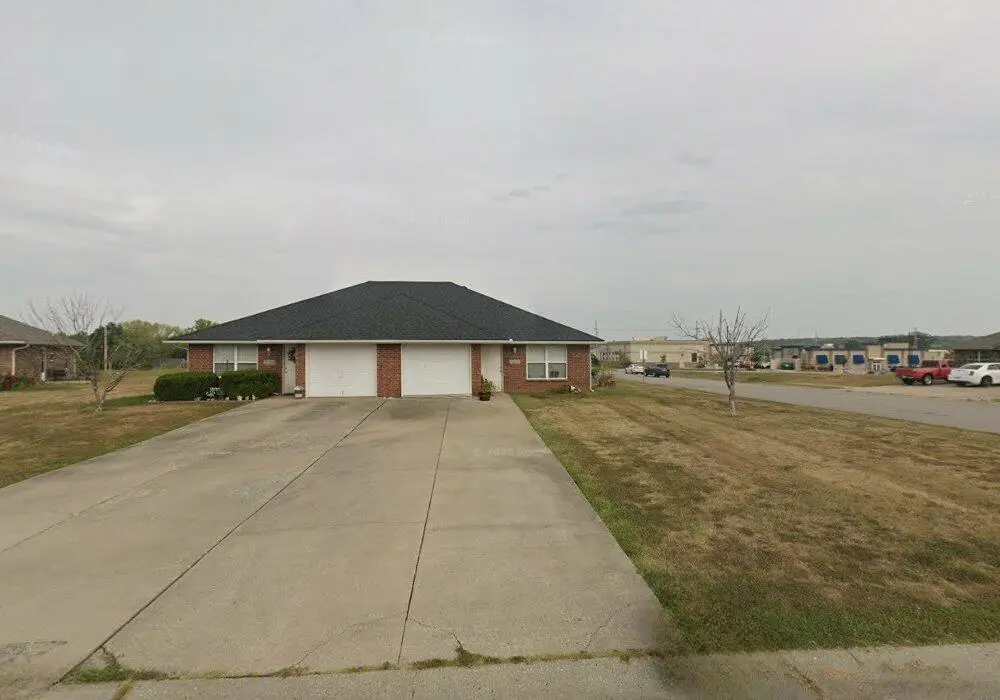
1251 Woodbury Ct
Grain Valley, MO 64029
$349,000D
4 bd · 3.0 ba ·
1,888 sqft ·
Built 2002
· MultiFamily
· Coming Soon
· 15 DOM
Cashflow @ list (25.0% down · 7.5%)
Estimated rent
$2,997/mo
Mortgage (P&I)
−$1,830
Tax + insurance
−$466
HOA
−$0
Vac / Maint / Mgmt
−$629
Net cashflow
$71/mo
Annual
$854/yr
Cap rate
6.54%
Cash-on-cash
0.87%
DSCR
1.04
1% rule
0.86%
Cash to close
$97,720
Investor read
- This is a 2 × 2-bed/1.0-bath units multifamily listed at $349k.
- At list price, monthly cash flow is $71 ($854/yr) — positive. Per door: $36/mo.
- The deal already cash-flows at list — no discount required.
- To meet the 1% rule (rent ≥ 1% of price), the offer needs to be $300k (14.1% below list).
- It's been on market 15 days — a 2% lower offer ($344k) is reasonable based on typical stale-listing flexibility.
- Recommended offer: $300k (14.1% below list) — sets the bar for 1% rule.
- Local home prices are declining (-3.0%/yr); year-one equity from $2k of loan paydown is wiped out by about $10k of value loss. Plan a longer hold.
- Location reads 76/100 on livability (#41 in MO, #3,383 nationally) — a middle-class / working-renter tenant base. Strengths: employment A+, cost of living A+, housing A+; Watch: amenities F, commute F.
- Grain Valley R-V (suburban): math 45% / reading 54% proficiency, ranked #30 of 324 in MO (top 9%) — families likely to look elsewhere, expect single-tenant / working-renter base with shorter leases; only 17% free/reduced lunch — higher-income household profile.
- Market conditions: Rents rising fast (+7.0%/yr); 109 active listings in the ZIP; 13 comparable units currently listed for rent nearby; rentals at typical pace (median 22d on market — plan ~3-4 weeks tenant-placement turnaround); solid renter incomes; 4,002 units permitted in Jackson County in 2024 (2,271 in 5+ unit buildings).
- Jackson County population projected at +4% by 2050 — modest demand growth; plan on rents tracking national, not racing it.
- Cap rate 6.5% vs local median 3.6% in Grain Valley — top-decile yield for the area; either an underpriced asset or a hidden risk that comps aren't pricing in. Stress-test before assuming the spread holds.
- This rent runs 39% of the median local income ($92k/yr) — at the standard rent-burdened threshold; future hikes will face affordability resistance.
Questions for listing agent
- Can we see the unit-by-unit rent roll, current vacancy, and any below-market leases? What's the average tenancy length?
- What capital expenditures (roof, boiler, parking lot, exteriors) have been made in the last 5 years, and what's planned in the next 2?
- Is there a deadline driving the sale (1031 exchange, divorce, estate, relocation)? That informs how much negotiation room exists.
- The area grade is low — what's the realistic commute time and amenity access for the typical tenant pool here? Any planned neighborhood developments (good or bad) we should know about?
- What's the average days-on-market for RENTAL listings here right now (not sales)? A rising rental-DOM trend means longer vacancies and softer asking-rent achievability than the comps imply.
- What's the recent tenant-quality profile in this submarket — average credit score on applications, eviction rate, late-payment / NSF rate, and stable-employment percentage? A property-management company in the area should have these aggregated.
- How much new apartment / multifamily construction is in the pipeline within 1–3 miles? Heavy new supply (>2% of stock underway) typically softens rents 12–24 months out; light construction supports rent growth.
CashFlowRE · CFR-DJFDYA5Y1H3AHJ
· Data 2 days ago
cashflowre.app · 2026-05-29