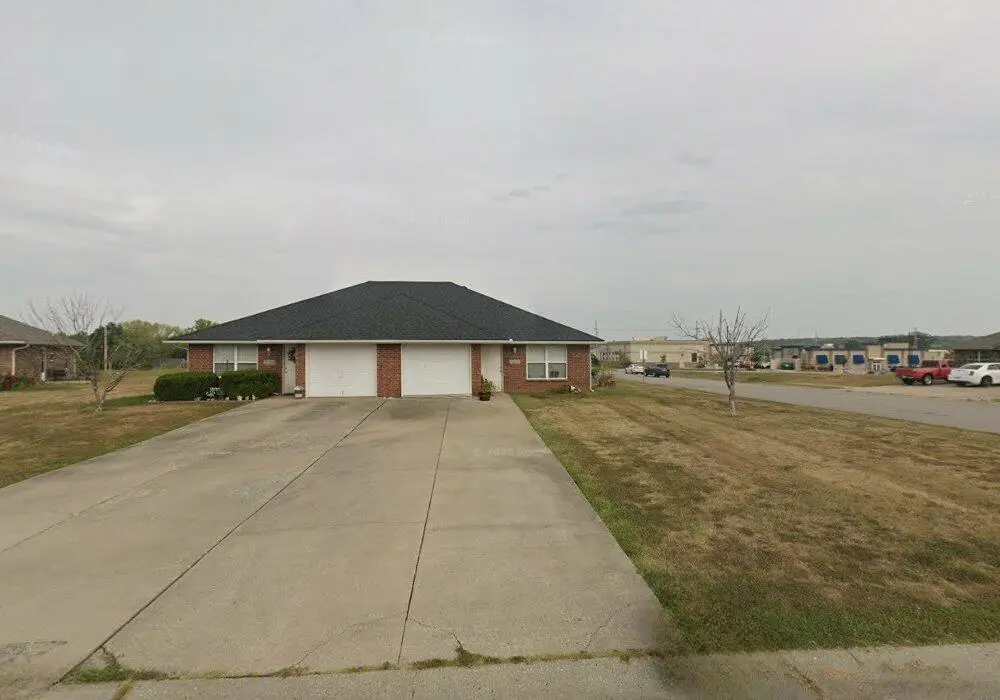
 Duplex
1251 Woodbury Ct · Grain Valley, MO
Flood risk 1/10 · Minimal
- FEMA flood zone
- X (unshaded)
- Chance of flooding over 30 yrs
- 0.0%
- Est. flood insurance / yr
- $507 – $1,088
Fire risk 3/10 · Minor
- Est. fire insurance / yr
- $1,054 – $1,958
Heat risk 4/10 · Minor
- Hot days now (above 107°F)
- 7 days/yr
- Hot days in 30 yrs
- 16 days/yr
Wind risk 2/10 · Minimal
- Chance of severe wind over 30 yrs
- —
Air-quality risk 3/10 · Minor
- Unhealthy air days now
- 3 days/yr
- Unhealthy air days in 30 yrs
- 4 days/yr
Risk factors via First Street. Map © Google.
Why this score? — see what drove the D grade
The composite is a weighted blend of 9 inputs, each scored 0–100. Each bar is that input's sub-score; the figure is the points it added to the 100-point composite (weight × sub-score).
- Cash flow +14.4/30.0
- ARV discount +7.5/15.0
- DSCR +4.4/10.0
- Schools +4.4/10.0
- Rent growth +4.3/5.0
- Livability +3.8/5.0
- 1% rule +3.6/10.0
- Condition / age +2.5/5.0
- Appreciation +0.0/10.0
$349,000
🖨 Deal sheet 📄 Offer letter ✓ Due diligence
Multi-family units
County records classify this as Multi-Family (2-4 Unit). Listing-text estimate: 2 units. confirmed
Listing remarks MLS
Fully Occupied Duplex. Units are 6 years old. There are others on the same street that could be part of a package deal.
Key facts
- 0.26 acre lot
- Garage
- Built 2002
Property features AI
Exterior
- Parking: Attached garage (property has a garage)
- Utilities: Public water; Independent heating and air for each unit; Independent water heaters for each unit
- Home design: Duplex residential income property; Single-story
- Construction: Brick veneer construction; Composition roof
- Exterior features: Brick veneer exterior; Lot approximately 11,326 square feet (per public records)
Interior
- Bedrooms: Each unit is a 2-bedroom
- Heating & cooling: Forced air heating; Electric cooling
- Interior features: Two-unit residential income property (duplex)
- Laundry & utility: Each unit has independent heating and air systems; Each unit has its own water heater
Neighborhood map
What this means for you Summary
Snapshot
- This is a 2 × 2-bed/1.0-bath units multifamily listed at $349k.
Deal economics
- At list price, monthly cash flow is $71 ($854/yr) — positive. Per door: $36/mo.
- The deal already cash-flows at list — no discount required.
- To meet the 1% rule (rent ≥ 1% of price), the offer needs to be $300k (14.1% below list).
- Recommended offer: $300k (14.1% below list) — sets the bar for 1% rule.
- Cap rate 6.5% vs local median 3.6% in Grain Valley — top-decile yield for the area; either an underpriced asset or a hidden risk that comps aren't pricing in. Stress-test before assuming the spread holds.
Location & tenants
- Location reads 76/100 on livability (#41 in MO, #3,383 nationally) — a middle-class / working-renter tenant base. Strengths: employment A+, cost of living A+, housing A+; Watch: amenities F, commute F.
- Grain Valley R-V (suburban): math 45% / reading 54% proficiency, ranked #30 of 324 in MO (top 9%) — families likely to look elsewhere, expect single-tenant / working-renter base with shorter leases; only 17% free/reduced lunch — higher-income household profile.
- Market conditions: Rents rising fast (+7.0%/yr); 109 active listings in the ZIP; 13 comparable units currently listed for rent nearby; rentals at typical pace (median 22d on market — plan ~3-4 weeks tenant-placement turnaround); solid renter incomes; 4,002 units permitted in Jackson County in 2024 (2,271 in 5+ unit buildings).
- This rent runs 39% of the median local income ($92k/yr) — at the standard rent-burdened threshold; future hikes will face affordability resistance.
Forward outlook
- Local home prices are declining (-3.0%/yr); year-one equity from $2k of loan paydown is wiped out by about $10k of value loss. Plan a longer hold.
- Jackson County population projected at +4% by 2050 — modest demand growth; plan on rents tracking national, not racing it.
Negotiation context
- It's been on market 15 days — a 2% lower offer ($344k) is reasonable based on typical stale-listing flexibility.
Questions for the listing agent
- Can we see the unit-by-unit rent roll, current vacancy, and any below-market leases? What's the average tenancy length?
- What capital expenditures (roof, boiler, parking lot, exteriors) have been made in the last 5 years, and what's planned in the next 2?
- Is there a deadline driving the sale (1031 exchange, divorce, estate, relocation)? That informs how much negotiation room exists.
- The area grade is low — what's the realistic commute time and amenity access for the typical tenant pool here? Any planned neighborhood developments (good or bad) we should know about?
- What's the average days-on-market for RENTAL listings here right now (not sales)? A rising rental-DOM trend means longer vacancies and softer asking-rent achievability than the comps imply.
- What's the recent tenant-quality profile in this submarket — average credit score on applications, eviction rate, late-payment / NSF rate, and stable-employment percentage? A property-management company in the area should have these aggregated.
- How much new apartment / multifamily construction is in the pipeline within 1–3 miles? Heavy new supply (>2% of stock underway) typically softens rents 12–24 months out; light construction supports rent growth.
Investment metrics
- 1% rule
- 0.86% ✗
- Cap rate
- 6.54%
- Cash-on-cash
- 0.87%
- DSCR
- 1.04
- GRM
- 9.7
CMA / ARV
No comps found within radius.
Projected returns pro-forma
-3.0% appreciation · 7.03% rent growth · sell at horizon
- IRR
- -10.7%
- Equity multiple
- 0.60×
- Total profit
- $-39,402
- Equity at exit
- $52,037
- IRR
- 3.4%
- Equity multiple
- 1.28×
- Total profit
- $27,807
- Equity at exit
- $30,175
Cash invested: $97,720 (down + closing). Projections, not guarantees.
Landlord ↔ Tenant lean methodology
- Overall (STATE)
- 81 Strongly Landlord-Friendly
- State Missouri
- 81 Strongly Landlord-Friendly · R+10
- County
- — inherits STATE
- City
- — inherits STATE
ZIP-level market 64029
- Home prices YoY
- -24.2%
- Rents YoY
- 7.0%
- Active inventory
- 109
- Price-to-rent
- 19.4×
Monthly cashflow live
- Estimated rent
- $2,997 high interval (Pro) →
- Mortgage (P&I)
- −$1,830
- Tax from tax record
- −$321 /mo · $3,850/yr
- Insurance
- −$145
- HOA
- −$0
- Vacancy / Maint / Mgmt
- −$629
- Net cashflow
- $71
Break-even live
2-unit breakdown (identical units grouped — click to expand)
| Units | Beds | Baths | Est. rent |
|---|---|---|---|
| 2× units | 2 | 1 | $2,998 |
| #1 | 2 | 1 | $1,499 |
| #2 | 2 | 1 | $1,499 |
| Total (2 units) | $2,997 | ||
UW: 25.0% down · 7.5% · 30yr · 1.5% tax · 5.0% vac · 8.0% maint · 8.0% mgmt
Financing live
Cash to close
- Down payment
- $87,250
- Closing costs
- $10,470
- Reserves months
- —
- Total cash needed
- —
Loan-product check · same deal, 3 products live
Conventional
25% down · 7.5% · 30yr
- Down + closing
- —
- Monthly P&I
- —
- Monthly cashflow
- —
- DSCR
- —
- Eligible?
- —
Personal DTI + credit; lowest rate.
DSCR
20% down · 8.5% · 30yr
- Down + closing
- —
- Monthly P&I
- —
- Monthly cashflow
- —
- DSCR
- —
- Eligible?
- —
No personal income docs; deal must DSCR.
Hard money
10% down · 12.0% · 12mo
- Down + closing
- —
- Monthly P&I
- —
- Monthly cashflow
- —
- DSCR
- —
- Eligible?
- —
Short-term bridge; refi at stabilization.
Rent comps 13 comps
| Address | Beds | Baths | Sqft | Rent | $/sqft | DOM | Units | Dist |
|---|---|---|---|---|---|---|---|---|
| 1282 NW Phelps Ct Unit 1282 Grain Valley, MO | 3.0 | 2.5 | 1288 | $1,550 | $1.20 | 12d | 1 | 0.09mi |
| 412 NW Woodbury Dr Grain Valley, MO | 3.0 | 2.0 | 2025 | $1,650 | $0.81 | 24d | 1 | 0.24mi |
| 1402 NE Mary Ct Grain Valley, MO | 3.0 | 2.5 | 1316 | $1,595 | $1.21 | 7d | 1 | 0.30mi |
| 1500 NE Shale Ct Grain Valley, MO | 3.0 | 2.5 | 1427 | $1,845 | $1.29 | 17d | 1 | 0.38mi |
| 1519 NE Erin Ct Grain Valley, MO | 3.0 | 2.5 | 1450 | $1,695 | $1.17 | 21d | 1 | 0.46mi |
| 901 NW Hilltop Ln Grain Valley, MO | 4.0 | 3.0 | 1971 | $2,305 | $1.17 | 21d | 1 | 0.50mi |
| 203 NE Katie Ct Grain Valley, MO | 4.0 | 3.0 | 2150 | $2,580 | $1.20 | 2d | 1 | 0.51mi |
| 316 NE Coldwater Creek Dr Grain Valley, MO | 3.0 | 2.5 | 1352 | $1,516 | $1.12 | 44d | 1 | 0.52mi |
| 630 Yennie St Grain Valley, MO | 1.0–3.0 | 1.0–2.0 | 1050 | $1,819 | $1.73 | 2d | 15 | 0.64mi |
| 1108 NW Golfview Dr Grain Valley, MO | 3.0 | 1.5 | 1364 | $1,890 | $1.39 | 7d | 1 | 0.77mi |
| 1305 NW High View Dr Grain Valley, MO | 4.0 | 3.0 | 1942 | $2,245 | $1.16 | 44d | 1 | 0.83mi |
| 930 NW Scenic Dr Grain Valley, MO | 3.0 | 2.0 | 1750 | $2,100 | $1.20 | 24d | 1 | 0.83mi |
| 1015 NW Willow Dr Grain Valley, MO | 3.0 | 2.0 | 1590 | $1,395 | $0.88 | 44d | 1 | 1.23mi |
Listing history 11 events
-
2026-06-18days on market $349,000 Coming Soon 15 DOM
-
2026-06-17days on market $349,000 Coming Soon 14 DOM
-
2026-06-16days on market $349,000 Coming Soon 13 DOM
-
2026-06-15days on market $349,000 Coming Soon 12 DOM
-
2026-06-13days on market $349,000 Coming Soon 10 DOM
-
2026-06-13days on market $349,000 Coming Soon 9 DOM
-
2026-06-09days on market $349,000 Coming Soon 6 DOM
-
2026-06-08days on market $349,000 Coming Soon 5 DOM
-
2026-06-07days on market $349,000 Coming Soon 4 DOM
-
2026-06-05remarks 41-char remark
-
2026-06-05$349,000 Coming Soon 1 DOM
ⓘ Source: listings_history table (triggers on properties + properties_extension) + one-shot
backfill from property_details.listing_events for pre-trigger history.
Tax reassessment forecast MO · Resets to sale price
- Current annual tax
- $3,850 · $321/mo
- Projected year-2 tax
- $3,850 · $321/mo
- Expected delta
- $0/yr ($0/mo · 0.0%)
ⓘ Screening estimate from a state-policy table — verify with the county assessor before closing.
Climate risk First Street
- Flood 1/10 Low FEMA zone X (unshaded) · 0% chance over 30 yrs
- Wildfire 3/10 Moderate
- Heat 4/10 Moderate 7 d/yr ≥107°F today · 16 d/yr by 30 yrs out
- Wind 2/10 Low
- Air quality 3/10 Moderate 3 unhealthy d/yr today · 4 by 30 yrs out
Nearby sold comps map
Loading sold comps map…
Walkable amenities ~0.75 mi
Loading nearby amenities…
Taxation est. · year 1
- Rental income
- $35,964
- − Mortgage interest
- −$19,549
- − Property taxes
- −$3,850
- − Insurance
- −$1,745
- − Repairs & maintenance
- −$2,877
- − Management
- −$2,877
- − Depreciation
- −$10,153
- Taxable loss
- −$5,088
- Est. tax savings @ 24.0%
- +$1,221
- After-tax cash flow
- $2,075/yr
For passive investors: Depreciation is non-cash, so a rental often shows a tax loss while cash-flowing — sheltering income. Rental losses are passive: they offset passive income freely, and up to $25,000/yr can offset ordinary (W-2) income if you actively participate and your MAGI is under $100k (phasing out to $0 by $150k); unused losses carry forward. On sale, claimed depreciation is recaptured at up to 25%, and gains may owe capital-gains tax (a 1031 exchange can defer both). Figures are a year-1 estimate at your 24.0% rate — not tax advice; consult a CPA.
Schools (NCES district)
- District
- Grain Valley R-V
- NCES district ID
- 2913080
- Math proficiency
- 45% ▼ -4.00%
- Reading proficiency
- 54% ▼ -1.00%
- Median HH income
- $67,451
- Composite
- 44.01/100
- National rank
- #2888
- State rank
- #30 of 324 in MO
Livability — Grain Valley
- Score
- 76/100
- State rank
- #41
- US rank
- #3383
Category grades
Schools grade is shown separately in the Schools card above.
Census & demographics
- Census place
- Grain Valley, MO
- County
- Jackson County · 687,798 people
- City population
- 21,961
- Metro
- Kansas City, MO-KS
- Population (ZIP)
- 21,961
- Household income
- $91,704
- Rent vs Own
- Severe rent burden
- 218.0
Population outlook (Jackson County) Hauer SSP2
- Today (2025)
- 719,589 people
- By 2030
- 731,456 · +1.6%
- By 2040
- 746,689 · +3.8%
- By 2050
- 749,289 · +4.1%
- By 2075
- 736,227 · +2.3%
- By 2100
- 668,210 · -7.1%
Race, ethnicity, and origin ACS 2023
- Neighborhood character
- Predominantly White (86%)
- Race & ethnicity
- White 86% Two or more races 5% Hispanic / Latino 5% Black 5%
- Common ancestry
- Italian 17% Lithuanian 2% Slovak 2%
- Foreign-born
- 2% · Canada
- Languages at home
- 97% English-only · Spanish 2%
Political lean MEDSL · Jackson
- 2024 margin
- D (+19.3) · D 58.9% · R 39.5% · Other 1.6%
- 2008→2024 swing
- -6.1pp toward R · 2008: 25.4pp · 2024: 19.3pp
- All cycles
- 2024: D+19.3 2020: D+22.0 2016: D+16.6 2012: D+19.0 2008: D+25.4
Not yet ingested
- Civics
- —
Market trends
- HPI YoY
- ▼ -72.90%
- Current HPI
- 228.5568
- Rent YoY
- ▲ 7.03%
- Metro
- Kansas City, MO-KS
- State GDP YoY
- ▲ 1.84%
- F500 in state
- 20
Industry mix (Fortune 500 HQ in MO)
| Industry | F500 HQs | Revenue |
|---|---|---|
| Healthcare | 1 | $163B |
|
||
| Insurance | 1 | $21B |
|
||
| Industrial Technology | 1 | $17B |
|
||
| Retail | 1 | $16B |
|
||
| Industrial Distribution | 1 | $10B |
|
||
| Utilities | 1 | $9B |
|
||
Price history
+105.4% since first listed5 events — show timeline
- 2026-06-04 Coming Soon $349,000 Heartland MLS as Distributed by MLS Grid
- 2009-01-01 Listing Removed — Heartland MLS as Distributed by MLS Grid
- 2008-04-03 Listed $169,900 Heartland MLS as Distributed by MLS Grid
- 2004-05-04 Sold (Public Records) — Public Records
- 2003-01-03 Sold (Public Records) — Public Records
Property tax history
+5.0%/yrLatest (2025): $3,850 · +13.8% YoY. Source: county tax records.
Cash-flow waterfall
monthlySold comps — $/sqft
last 12 mo · ≤1 miLoading sold comps…