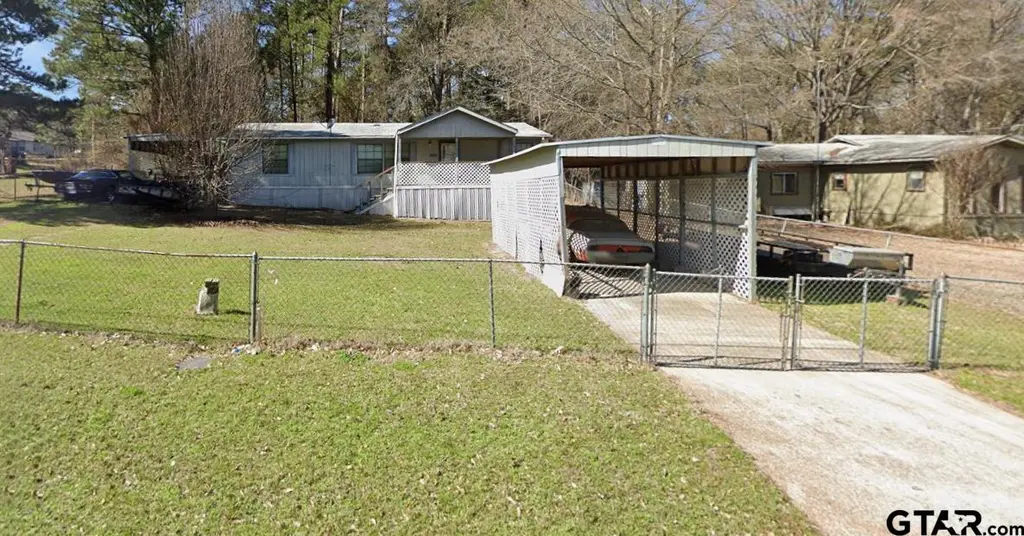
4654 Skyline Dr
Sunrise Shores, TX 75758
$60,000B-
3 bd · 2.0 ba ·
1,344 sqft ·
Built 1993
· Manufactured
· Active
· 23 DOM
Cashflow @ list (25.0% down · 7.5%)
Estimated rent
$1,500/mo
Mortgage (P&I)
−$315
Tax + insurance
−$173
HOA
−$0
Vac / Maint / Mgmt
−$315
Net cashflow
$697/mo
Annual
$8,366/yr
Cap rate
20.24%
Cash-on-cash
49.79%
DSCR
3.22
1% rule
2.50%
Cash to close
$16,800
Investor read
- This is a 3-bed/2.0-bath manufactured listed at $60k.
- At list price, monthly cash flow is $697 ($8k/yr) — positive.
- The deal already cash-flows at list — no discount required.
- Meets the 1% rule at list price ($2k rent vs $60k).
- It's been on market 23 days — a 2% lower offer ($59k) is reasonable based on typical stale-listing flexibility.
- Recommended offer: $59k (1.5% below list) — sets the bar for market timing.
- Local home prices are declining (-3.0%/yr); year-one equity from $415 of loan paydown is wiped out by about $2k of value loss. Plan a longer hold.
- Location reads: area grade B — affects rentability + tenant quality, not the cash-flow math above.
- Brownsboro ISD (rural): math 42% / reading 46% proficiency, ranked #290 of 826 in TX (top 35%) — families likely to look elsewhere, expect single-tenant / working-renter base with shorter leases.
- Zoned schools: Brownsboro El (math 32% / reading 37%, grade F, #1,995 of 4,322 statewide, top 50%, 429 students, 66% FRL); Brownsboro J H (math 48% / reading 49%, grade C-, #392 of 1,662 statewide, top 24%, 405 students, 60% FRL); Brownsboro H S (math 31% / reading 63%, grade D-, #591 of 1,632 statewide, top 38%, 757 students, 50% FRL).
- Watch-outs: property tax is 3.0% of price.
- Market conditions: 228 active listings in the ZIP; 263 units permitted in Henderson County in 2024 (0 in 5+ unit buildings).
- 6 sale attempts since 5y ago; this cycle's ask has dropped $10k (14%) from the opening price — seller is motivated, your offer sets the floor, not the list.
- At projected returns (-3.0% appreciation + 3.0% rent growth), your $17k cash investment doubles in ~3 years — after that, you're playing with house money.
- Climate carrying-cost: major wind risk, 64% chance of damaging wind over 30y; extreme-heat days projected 7→27/yr by 2055 (HVAC capex compounding) — expect insurance premiums to compound above CPI over the hold.
- Cap rate 20.2% vs local median 4.1% in Sunrise Shores — top-decile yield for the area; either an underpriced asset or a hidden risk that comps aren't pricing in. Stress-test before assuming the spread holds.
Questions for listing agent
- Property tax is high relative to price — has the assessment been appealed recently, and will the sale trigger a re-assessment?
- Is there a deadline driving the sale (1031 exchange, divorce, estate, relocation)? That informs how much negotiation room exists.
- What's the average days-on-market for RENTAL listings here right now (not sales)? A rising rental-DOM trend means longer vacancies and softer asking-rent achievability than the comps imply.
- What's the recent tenant-quality profile in this submarket — average credit score on applications, eviction rate, late-payment / NSF rate, and stable-employment percentage? A property-management company in the area should have these aggregated.
- How much new for-sale + rental construction is in the pipeline within 1–3 miles? Heavy new supply typically softens prices + rents 12–24 months out; constrained supply supports both.
CashFlowRE · CFR-DJGKDJBM8N4GJX
· Data 1 day ago
cashflowre.app · 2026-05-29