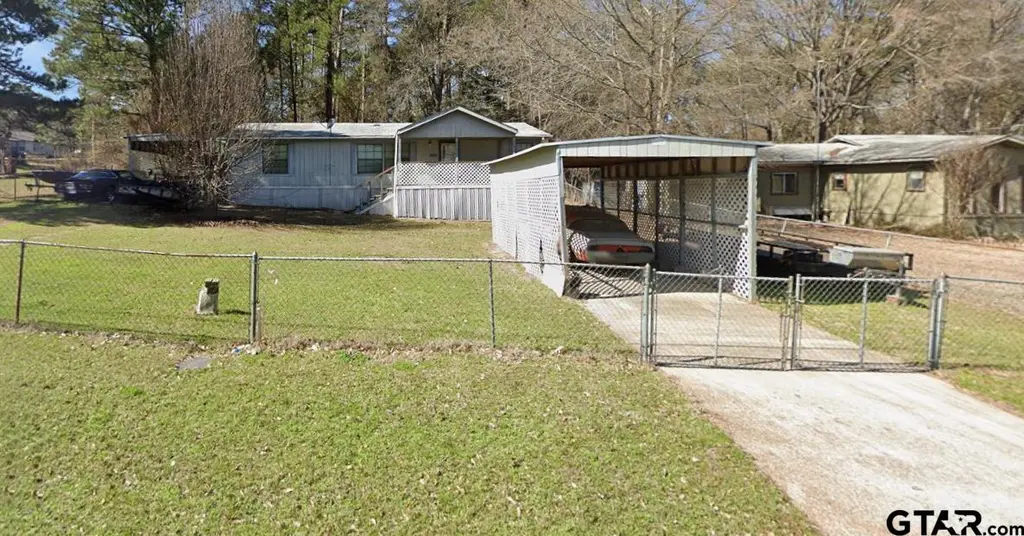
4654 Skyline Dr · Sunrise Shores, TX
Flood risk 1/10 · Minimal
- FEMA flood zone
- X (unshaded)
- Chance of flooding over 30 yrs
- 0.0%
- Est. flood insurance / yr
- $507 – $1,088
Fire risk 3/10 · Minor
- Est. fire insurance / yr
- $1,222 – $2,270
Heat risk 7/10 · Major
- Hot days now (above 109°F)
- 7 days/yr
- Hot days in 30 yrs
- 27 days/yr
Wind risk 6/10 · Moderate
- Chance of severe wind over 30 yrs
- 64.0%
Air-quality risk 1/10 · Minimal
- Unhealthy air days now
- 0 days/yr
- Unhealthy air days in 30 yrs
- 0 days/yr
Risk factors via First Street. Map © Google.
Why this score? — see what drove the B- grade
The composite is a weighted blend of 9 inputs, each scored 0–100. Each bar is that input's sub-score; the figure is the points it added to the 100-point composite (weight × sub-score).
- Cash flow +30.0/30.0
- 1% rule +10.0/10.0
- DSCR +10.0/10.0
- ARV discount +7.5/15.0
- Schools +3.7/10.0
- Rent growth +2.5/5.0
- Livability +2.5/5.0
- Condition / age +2.5/5.0
- Appreciation +0.0/10.0
$60,000
🖨 Deal sheet (PDF) 📄 Offer letter ✓ Due diligence
Listing remarks MLS
3/2 Doublewide located on a large corner lot in the Lake Palestine community of Sunrise Shores. Great size bedrooms, open floor plan and plenty of storage. Attached carport with storage building and additional covered parking are the perfect place for your boat or RV. Upgrades in the last year include new kitchen flooring and appliances (stove, refrigerator, washer and dryer).
Key facts
- Lake community
- Brownsboro isd
- Lake palestine
Tags
Property features AI
Exterior
- Security: Smoke detectors
- Utilities: Public water; Septic tank; Cable available
- Home design: Single-story manufactured (mobile) home; Residential property
- Construction: Composition roof
- Exterior features: Patio; Chain link fence; Located on Lake Palestine
Interior
- Kitchen: Dishwasher; Electric oven; Electric range
- Bathrooms: 2 full bathrooms
- Heating & cooling: Central heating (electric); Central air; Ceiling fans
- Interior features: Ceiling fans; Central air; Electric central heating; Dishwasher; Electric oven and range; Electric water heater
- Laundry & utility: Electric water heater
Neighborhood map
What this means for you Summary
Snapshot
- This is a 3-bed/2.0-bath manufactured listed at $60k.
Deal economics
- At list price, monthly cash flow is $697 ($8k/yr) — positive.
- The deal already cash-flows at list — no discount required.
- Meets the 1% rule at list price ($2k rent vs $60k).
- Recommended offer: $59k (1.5% below list) — sets the bar for market timing.
- Cap rate 20.2% vs local median 4.1% in Sunrise Shores — top-decile yield for the area; either an underpriced asset or a hidden risk that comps aren't pricing in. Stress-test before assuming the spread holds.
Location & tenants
- Location reads: area grade B — affects rentability + tenant quality, not the cash-flow math above.
- Brownsboro ISD (rural): math 42% / reading 46% proficiency, ranked #290 of 826 in TX (top 35%) — families likely to look elsewhere, expect single-tenant / working-renter base with shorter leases.
- Zoned schools: Brownsboro El (math 32% / reading 37%, grade F, #1,995 of 4,322 statewide, top 50%, 429 students, 66% FRL); Brownsboro J H (math 48% / reading 49%, grade C-, #392 of 1,662 statewide, top 24%, 405 students, 60% FRL); Brownsboro H S (math 31% / reading 63%, grade D-, #591 of 1,632 statewide, top 38%, 757 students, 50% FRL).
- Market conditions: 228 active listings in the ZIP; 263 units permitted in Henderson County in 2024 (0 in 5+ unit buildings).
Forward outlook
- Local home prices are declining (-3.0%/yr); year-one equity from $415 of loan paydown is wiped out by about $2k of value loss. Plan a longer hold.
- At projected returns (-3.0% appreciation + 3.0% rent growth), your $17k cash investment doubles in ~3 years — after that, you're playing with house money.
Negotiation context
- It's been on market 23 days — a 2% lower offer ($59k) is reasonable based on typical stale-listing flexibility.
- 6 sale attempts since 5y ago; this cycle's ask has dropped $10k (14%) from the opening price — seller is motivated, your offer sets the floor, not the list.
Risks & watch-outs
- Watch-outs: property tax is 3.0% of price.
- Climate carrying-cost: major wind risk, 64% chance of damaging wind over 30y; extreme-heat days projected 7→27/yr by 2055 (HVAC capex compounding) — expect insurance premiums to compound above CPI over the hold.
Questions for the listing agent
- Property tax is high relative to price — has the assessment been appealed recently, and will the sale trigger a re-assessment?
- Is there a deadline driving the sale (1031 exchange, divorce, estate, relocation)? That informs how much negotiation room exists.
- What's the average days-on-market for RENTAL listings here right now (not sales)? A rising rental-DOM trend means longer vacancies and softer asking-rent achievability than the comps imply.
- What's the recent tenant-quality profile in this submarket — average credit score on applications, eviction rate, late-payment / NSF rate, and stable-employment percentage? A property-management company in the area should have these aggregated.
- How much new for-sale + rental construction is in the pipeline within 1–3 miles? Heavy new supply typically softens prices + rents 12–24 months out; constrained supply supports both.
Investment metrics
- 1% rule
- 2.50% ✓
- Cap rate
- 20.24%
- Cash-on-cash
- 49.79%
- DSCR
- 3.22
- GRM
- 3.3
CMA / ARV
- ARV (on-the-fly)
- $158,592
- Comps found
- 2
Show comp detail 2 sales within ~0.75 mi
| Address | Dist | Beds/Ba | Sqft | Sold | Price | $/sf | Match |
|---|---|---|---|---|---|---|---|
| 20871 Woodwind Dr | 0.45mi | 3/2.0 | 1,201 (-11%) | 4mo | $62,000 | $52 | 58 |
| 4542 Pineview Dr | 0.11mi | 3/2.0 | 1,190 (-12%) | 22mo | $140,000 | $118 | 58 |
Match score weights: distance 35% · size 25% · config 20% · recency 20%. Top-matched comps best support the ARV.
Projected returns pro-forma
-3.0% appreciation · 3.0% rent growth · sell at horizon
- IRR
- 47.5%
- Equity multiple
- 3.07×
- Total profit
- $34,745
- Equity at exit
- $8,946
- IRR
- 53.2%
- Equity multiple
- 6.22×
- Total profit
- $87,703
- Equity at exit
- $5,188
Cash invested: $16,800 (down + closing). Projections, not guarantees.
Landlord ↔ Tenant lean methodology
- Overall (STATE)
- 87 Strongly Landlord-Friendly
- State Texas
- 87 Strongly Landlord-Friendly · R+5
- County
- — inherits STATE
- City
- — inherits STATE
ZIP-level market 75758
- Home prices YoY
- -27.6%
- Active inventory
- 228
- Price-to-rent
- 3.3×
Monthly cashflow live
- Estimated rent
- $1,500 medium interval (Pro) →
- Mortgage (P&I)
- −$315
- Tax from tax record
- −$148 /mo · $1,779/yr
- Insurance
- −$25
- HOA
- −$0
- Vacancy / Maint / Mgmt
- −$315
- Net cashflow
- $697
Break-even live
Sensitivity live
| Price | -10% $731 | -5% $714 | +0% $697 | +5% $680 | +10% $663 |
|---|---|---|---|---|---|
| Rent | -10% $579 | -5% $638 | +0% $697 | +5% $756 | +10% $816 |
| Rate | -1.0pp $727 | -0.5pp $712 | base $697 | +0.5pp $682 | +1.0pp $666 |
UW: 25.0% down · 7.5% · 30yr · 1.5% tax · 5.0% vac · 8.0% maint · 8.0% mgmt
Financing live
Cash to close
- Down payment
- $15,000
- Closing costs
- $1,800
- Reserves months
- —
- Total cash needed
- —
Loan-product check · same deal, 3 products live
Conventional
25% down · 7.5% · 30yr
- Down + closing
- —
- Monthly P&I
- —
- Monthly cashflow
- —
- DSCR
- —
- Eligible?
- —
Personal DTI + credit; lowest rate.
DSCR
20% down · 8.5% · 30yr
- Down + closing
- —
- Monthly P&I
- —
- Monthly cashflow
- —
- DSCR
- —
- Eligible?
- —
No personal income docs; deal must DSCR.
Hard money
10% down · 12.0% · 12mo
- Down + closing
- —
- Monthly P&I
- —
- Monthly cashflow
- —
- DSCR
- —
- Eligible?
- —
Short-term bridge; refi at stabilization.
Listing history 18 events
-
2026-06-21days on market $60,000 Active 23 DOM
-
2026-06-19remarks 699-char remark
-
2026-06-19pricedays on market $60,000 Active 21 DOM
-
2026-06-18days on market $70,000 Active 20 DOM
-
2026-06-17days on market $70,000 Active 19 DOM
-
2026-06-16days on market $70,000 Active 18 DOM
-
2026-06-15days on market $70,000 Active 17 DOM
-
2026-06-14days on market $70,000 Active 15 DOM
-
2026-06-13days on market $70,000 Active 14 DOM
-
2026-06-10days on market $70,000 Active 12 DOM
-
2026-06-09days on market $70,000 Active 11 DOM
-
2026-06-08days on market $70,000 Active 10 DOM
-
2026-06-07days on market $70,000 Active 9 DOM
-
2026-06-02days on market $70,000 Active 4 DOM
-
2026-06-01days on market $70,000 Active 3 DOM
-
2026-05-31days on market $70,000 Active 2 DOM
-
2026-05-30remarks 679-char remark
-
2026-05-30$70,000 Active 1 DOM
ⓘ Source: listings_history table (triggers on properties + properties_extension) + one-shot
backfill from property_details.listing_events for pre-trigger history.
Tax reassessment forecast TX · Resets to sale price
- Current annual tax
- $1,779 · $148/mo
- Projected year-2 tax
- $1,779 · $148/mo
- Expected delta
- $0/yr ($0/mo · 0.0%)
ⓘ Screening estimate from a state-policy table — verify with the county assessor before closing.
Climate risk First Street
- Flood 1/10 Low FEMA zone X (unshaded) · 0% chance over 30 yrs
- Wildfire 3/10 Moderate
- Heat 7/10 Severe 7 d/yr ≥109°F today · 27 d/yr by 30 yrs out
- Wind 6/10 Major 64% chance of damaging wind over 30 yrs
- Air quality 1/10 Low 0 unhealthy d/yr today · 0 by 30 yrs out
Nearby sold comps map
Loading sold comps map…
Walkable amenities ~0.75 mi
Loading nearby amenities…
Taxation est. · year 1
- Rental income
- $18,001
- − Mortgage interest
- −$3,361
- − Property taxes
- −$1,779
- − Insurance
- −$300
- − Repairs & maintenance
- −$1,440
- − Management
- −$1,440
- − Depreciation
- −$1,745
- Taxable income
- $7,935
- Est. tax owed @ 24.0%
- −$1,904
- After-tax cash flow
- $6,461/yr
For passive investors: Depreciation is non-cash, so a rental often shows a tax loss while cash-flowing — sheltering income. Rental losses are passive: they offset passive income freely, and up to $25,000/yr can offset ordinary (W-2) income if you actively participate and your MAGI is under $100k (phasing out to $0 by $150k); unused losses carry forward. On sale, claimed depreciation is recaptured at up to 25%, and gains may owe capital-gains tax (a 1031 exchange can defer both). Figures are a year-1 estimate at your 24.0% rate — not tax advice; consult a CPA.
Schools (NCES district)
- District
- Brownsboro ISD
- NCES district ID
- 4811640
- Math proficiency
- 42% ▼ -5.00%
- Reading proficiency
- 46% ▬ 0.00%
- Median HH income
- $45,624
- Composite
- 37.38/100
- National rank
- #4429
- State rank
- #290 of 826 in TX
Livability — Sunrise Shores
No livability data for this city. (Only ~50 U.S. cities are tracked.)
Census & demographics
- Census place
- Sunrise Shores, TX
- Population (ZIP)
- 10,357
Population outlook (Henderson County) Hauer SSP2
- Today (2025)
- 80,471 people
- By 2030
- 80,608 · +0.2%
- By 2040
- 80,087 · -0.5%
- By 2050
- 78,208 · -2.8%
- By 2075
- 72,423 · -10.0%
- By 2100
- 61,012 · -24.2%
Race, ethnicity, and origin ACS 2023
- Neighborhood character
- Predominantly White (79%)
- Race & ethnicity
- White 79% Hispanic / Latino 16% Two or more races 9% Black 2%
- Hispanic origin (detail)
- Mexican 14%
- Common ancestry
- Slovak 3% Serbian 2% Romanian 1%
- Foreign-born
- 5% · Canada, Vietnam
- Languages at home
- 91% English-only · Spanish 8% Other Indo-European 1%
Political lean MEDSL · Henderson
- 2024 margin
- Solid R (+63.5) · D 18.0% · R 81.4%
- 2008→2024 swing
- -18.8pp toward R · 2008: -44.6pp · 2024: -63.5pp
- All cycles
- 2024: R+63.5 2020: R+60.2 2016: R+60.0 2012: R+54.8 2008: R+44.6
Not yet ingested
- Civics
- —
Market trends
- HPI YoY
- ▼ -73.16%
- Current HPI
- 192.0837
- Rent YoY
- —
- Metro
- —
- State GDP YoY
- ▲ 3.95%
- F500 in state
- 110
Industry mix (Fortune 500 HQ in TX)
| Industry | F500 HQs | Revenue |
|---|---|---|
| Energy | 16 | $1,198B |
|
||
| Technology | 5 | $198B |
|
||
| Engineering / Construction | 4 | $72B |
|
||
| Energy Services | 3 | $60B |
|
||
| Utilities | 3 | $41B |
|
||
| Healthcare | 2 | $330B |
|
||
Price history
-17.6% since first listed18 events — show timeline
- 2026-05-29 Listed $70,000 GTAR
- 2024-04-05 Sold (Public Records) — Public Records
- 2024-04-05 Sold (MLS) — LAAR
- 2024-04-05 Sold (MLS) — GTAR
- 2024-03-28 Delisted — GTAR
- 2024-03-20 Listed $89,500 GTAR
- 2024-03-20 Listed $89,500 LAAR
- 2022-03-31 Sold (MLS) — GTAR
- 2022-03-25 Sold (Public Records) — Public Records
- 2022-03-24 Sold (MLS) — NTREIS
- 2022-03-02 Pending — NTREIS
- 2022-02-28 Pending — NTREIS
- 2022-02-22 Listed $79,000 GTAR
- 2022-02-06 Listed $79,000 NTREIS
- 2022-01-26 Listing Removed — NTREIS
- 2022-01-25 Price Changed $79,000 NTREIS
- 2021-11-27 Listed $85,000 NTREIS
- 2003-02-07 Sold (Public Records) — Public Records
Property tax history
+4.7%/yrLatest (2025): $1,779 · +5.9% YoY. Source: county tax records.
Cash-flow waterfall
monthlySold comps — $/sqft
last 12 mo · ≤1 miLoading sold comps…