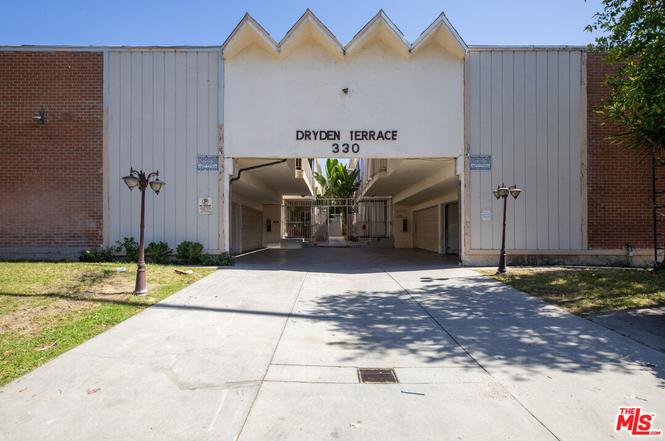
330 E Dryden St
Glendale, CA 91207
$5,000,000C+
36 bd · 36.0 ba ·
21,020 sqft ·
Built 1961
· MultiFamily
· Active
· 4 DOM
Cashflow @ list (25.0% down · 7.5%)
Estimated rent
$50,134/mo
Mortgage (P&I)
−$26,221
Tax + insurance
−$3,181
HOA
−$0
Vac / Maint / Mgmt
−$10,528
Net cashflow
$10,204/mo
Annual
$122,448/yr
Cap rate
8.74%
Cash-on-cash
8.75%
DSCR
1.39
1% rule
1.00%
Cash to close
$1,400,000
Investor read
- This is a 18 × 2-bed/2.0-bath units multifamily listed at $5.00M.
- At list price, monthly cash flow is $10k ($122k/yr) — positive. Per door: $567/mo.
- The deal already cash-flows at list — no discount required.
- Meets the 1% rule at list price ($50k rent vs $5.00M).
- Only 4 days on market — expect competitive offers; lowballing is unlikely to land.
- In year one you build about $35k of equity ($35k loan paydown + $50 appreciation (0.0% local appreciation)).
- Location reads 72/100 on livability (#201 in CA) — a middle-class / working-renter tenant base. Strengths: amenities A+, commute A+, schools B+; Watch: health & safety C-, cost of living F.
- Glendale Unified (urban): math 53% / reading 66% proficiency, ranked #81 of 517 in CA (top 16%) — acceptable for families but not a draw, mixed tenant base, ~2y average lease.
- Market conditions: Rents falling (-11.3%/yr); 28 active listings in the ZIP; high-income renter base; 19,697 units permitted in Los Angeles County in 2024 (9,426 in 5+ unit buildings).
- Los Angeles County population projected at +9% by 2050 — modest demand growth; plan on rents tracking national, not racing it.
- 2 sale attempts with the ask held roughly flat each time — persistent listings suggest the price (not the market) is what's stuck; bring a comps-based counter.
- At projected returns (0.0% appreciation + 0.0% rent growth), your $1.40M cash investment doubles in ~9 years — after that, you're playing with house money.
- By year 7, paydown + projected appreciation supports a ~$306k cash-out refi (75% LTV) — recoverable capital for the next deal without selling this one.
- Climate carrying-cost: major wildfire risk; extreme-heat days projected 7→21/yr by 2055 (HVAC capex compounding) — expect insurance premiums to compound above CPI over the hold.
- Cap rate 8.7% vs local median 1.9% in Glendale — top-decile yield for the area; either an underpriced asset or a hidden risk that comps aren't pricing in. Stress-test before assuming the spread holds.
- At $50,134/mo this rent would consume 509% of the median local household income ($118k/yr) (locally 873% of renters already pay >50% of income on rent) — very limited rent-growth headroom before tenants either downsize or default.
Questions for listing agent
- Can we see the unit-by-unit rent roll, current vacancy, and any below-market leases? What's the average tenancy length?
- What capital expenditures (roof, boiler, parking lot, exteriors) have been made in the last 5 years, and what's planned in the next 2?
- Built in 1961 — when were the roof, HVAC, electrical panel, plumbing, and water heater last replaced?
- Is there a deadline driving the sale (1031 exchange, divorce, estate, relocation)? That informs how much negotiation room exists.
- Schools are B-rated — typically a magnet for longer-tenancy family renters. What's the average tenant stay here, and is there a school-zone premium baked into asking?
- What's the average days-on-market for RENTAL listings here right now (not sales)? A rising rental-DOM trend means longer vacancies and softer asking-rent achievability than the comps imply.
- What's the recent tenant-quality profile in this submarket — average credit score on applications, eviction rate, late-payment / NSF rate, and stable-employment percentage? A property-management company in the area should have these aggregated.
- How much new apartment / multifamily construction is in the pipeline within 1–3 miles? Heavy new supply (>2% of stock underway) typically softens rents 12–24 months out; light construction supports rent growth.
CashFlowRE · CFR-DKJFTWE2736P36
· Data 5 days ago
cashflowre.app · 2026-05-29