 18-Plex
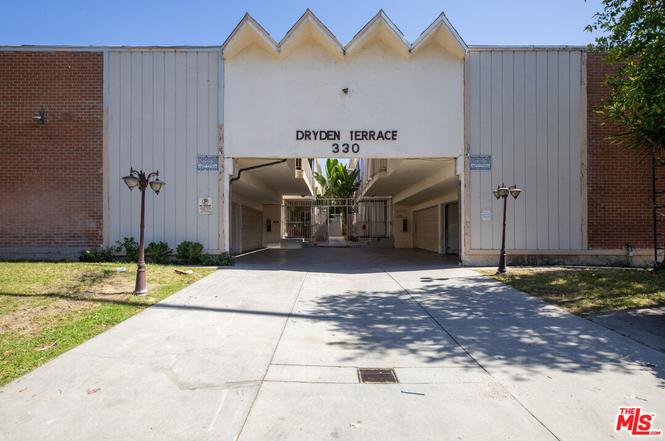
330 E Dryden St · Glendale, CA
Flood risk 1/10 · Minimal
- FEMA flood zone
- X (unshaded)
- Chance of flooding over 30 yrs
- 0.0%
- Est. flood insurance / yr
- $507 – $1,088
Fire risk 6/10 · Moderate
- Est. fire insurance / yr
- $659 – $1,223
Heat risk 6/10 · Moderate
- Hot days now (above 98°F)
- 7 days/yr
- Hot days in 30 yrs
- 21 days/yr
Wind risk 1/10 · Minimal
- Chance of severe wind over 30 yrs
- —
Air-quality risk 6/10 · Moderate
- Unhealthy air days now
- 11 days/yr
- Unhealthy air days in 30 yrs
- 11 days/yr
Risk factors via First Street. Map © Google.
Why this score? — see what drove the C+ grade
The composite is a weighted blend of 9 inputs, each scored 0–100. Each bar is that input's sub-score; the figure is the points it added to the 100-point composite (weight × sub-score).
- Cash flow +24.5/30.0
- ARV discount +9.2/15.0
- DSCR +7.9/10.0
- Schools +5.1/10.0
- 1% rule +5.0/10.0
- Appreciation +5.0/10.0
- Livability +3.6/5.0
- Condition / age +2.5/5.0
- Rent growth +0.0/5.0
$5,000,000
🖨 Deal sheet 📄 Offer letter ✓ Due diligence
Multi-family units
County records classify this as Multi-Family (5+ Unit). Listing-text estimate: 18 units. confirmed
5+ unit building — per-unit beds/baths from public records are typically unavailable; the breakdown below (if shown) is an estimate from the listing text.
Listing remarks MLS
Charming multi-unit opportunity in the highly sought-after Rossmoyne neighborhood of Glendale an 18-unit mid-century building (built 1961) offering approximately 21,020 sq ft on a 0.41-acre lot. A well-located asset with modern potential needs TLC and updating throughout, making this perfect for investors or an adaptive-use conversion. Glendale lifestyle & location highlights. Just 10 miles north of Downtown L. A. , inside the center of one of the safest, most community-oriented cities in the San Fernando Valley . Top-tier schools via Glendale Unified School District, known for academic excellence and cultural inclusivity. Near shopping, small boutiques, restaurants and neighborhood markets. Major attractions nearby; museum of Neon Art world class and just steps from Downtown Central Park, Alex Theatre historic and prestigious performing arts venue with 250+ annual events. Surrounded by Griffith Park, Descanso Gardens, Bird Sanctuary, and the Griffith Observatory all under 10 minutes away. Ideal for repositioning or converting to higher-end rentals or boutique condos. Building condition note: Requires modernization common areas, flooring, kitchens, electrical/plumbing systems should be updated.
Key facts
- Ample parking
- Strong tenant demand
- 0.41 acre lot
Tags
Property features AI
Finance
- Other: Property zoned GLR4YY; Assessor parcel number available (not shown here)
- Financial info: Gross scheduled/actual income shown as $15,000; Unit 1 actual rent reported as $15,000 and listed rent $2,500; Projected rent for Unit 1 indicated as $45,000; Total annual expenses reported as $12,592; Gross income $15,000; Gross operating income $15,000; Gross rent multiplier: 27; Vacancy rate: 10%
- HOA & community: Total of 18 units in the complex
Exterior
- Parking: Other garage type
- Security: No security features provided
- Utilities: No water, sewer, or power details provided
- Home design: Residential income property; Multi-level configuration; One building on the lot
- Construction: No construction material, roof, foundation, or year built provided
- Exterior features: Approximately 0.41-acre lot (96 x 185 dimensions); No additional exterior structures
Interior
- Kitchen: No specific kitchen appliance details provided
- Bedrooms: One 2-bedroom unit
- Flooring: No flooring details provided
- Bathrooms: One 2.00-bath unit
- Heating & cooling: Central heat; Central cooling
- Interior features: Multi-level building
- Laundry & utility: No laundry or utility appliance details provided
Neighborhood map
What this means for you Summary
Snapshot
- This is a 18 × 2-bed/2.0-bath units multifamily listed at $5.00M.
Deal economics
- At list price, monthly cash flow is $10k ($122k/yr) — positive. Per door: $567/mo.
- The deal already cash-flows at list — no discount required.
- Meets the 1% rule at list price ($50k rent vs $5.00M).
- Cap rate 8.7% vs local median 1.9% in Glendale — top-decile yield for the area; either an underpriced asset or a hidden risk that comps aren't pricing in. Stress-test before assuming the spread holds.
Location & tenants
- Location reads 72/100 on livability (#201 in CA) — a middle-class / working-renter tenant base. Strengths: amenities A+, commute A+, schools B+; Watch: health & safety C-, cost of living F.
- Glendale Unified (urban): math 53% / reading 66% proficiency, ranked #81 of 517 in CA (top 16%) — acceptable for families but not a draw, mixed tenant base, ~2y average lease.
- Market conditions: Rents falling (-11.3%/yr); 28 active listings in the ZIP; high-income renter base; 19,697 units permitted in Los Angeles County in 2024 (9,426 in 5+ unit buildings).
- At $50,134/mo this rent would consume 509% of the median local household income ($118k/yr) (locally 873% of renters already pay >50% of income on rent) — very limited rent-growth headroom before tenants either downsize or default.
Forward outlook
- In year one you build about $35k of equity ($35k loan paydown + $50 appreciation (0.0% local appreciation)).
- Los Angeles County population projected at +9% by 2050 — modest demand growth; plan on rents tracking national, not racing it.
- At projected returns (0.0% appreciation + 0.0% rent growth), your $1.40M cash investment doubles in ~9 years — after that, you're playing with house money.
- By year 7, paydown + projected appreciation supports a ~$306k cash-out refi (75% LTV) — recoverable capital for the next deal without selling this one.
Negotiation context
- Only 4 days on market — expect competitive offers; lowballing is unlikely to land.
- 2 sale attempts with the ask held roughly flat each time — persistent listings suggest the price (not the market) is what's stuck; bring a comps-based counter.
Risks & watch-outs
- Climate carrying-cost: major wildfire risk; extreme-heat days projected 7→21/yr by 2055 (HVAC capex compounding) — expect insurance premiums to compound above CPI over the hold.
Questions for the listing agent
- Can we see the unit-by-unit rent roll, current vacancy, and any below-market leases? What's the average tenancy length?
- What capital expenditures (roof, boiler, parking lot, exteriors) have been made in the last 5 years, and what's planned in the next 2?
- Built in 1961 — when were the roof, HVAC, electrical panel, plumbing, and water heater last replaced?
- Is there a deadline driving the sale (1031 exchange, divorce, estate, relocation)? That informs how much negotiation room exists.
- Schools are B-rated — typically a magnet for longer-tenancy family renters. What's the average tenant stay here, and is there a school-zone premium baked into asking?
- What's the average days-on-market for RENTAL listings here right now (not sales)? A rising rental-DOM trend means longer vacancies and softer asking-rent achievability than the comps imply.
- What's the recent tenant-quality profile in this submarket — average credit score on applications, eviction rate, late-payment / NSF rate, and stable-employment percentage? A property-management company in the area should have these aggregated.
- How much new apartment / multifamily construction is in the pipeline within 1–3 miles? Heavy new supply (>2% of stock underway) typically softens rents 12–24 months out; light construction supports rent growth.
Investment metrics
- 1% rule
- 1.00% ✓
- Cap rate
- 8.74%
- Cash-on-cash
- 8.75%
- DSCR
- 1.39
- GRM
- 8.3
CMA / ARV
- ARV (on-the-fly)
- $5,191,940
- Comps found
- 1
Show comp detail 1 sale within ~0.75 mi
| Address | Dist | Beds/Ba | Sqft | Sold | Price | $/sf | Match |
|---|---|---|---|---|---|---|---|
| 330 E Dryden St | 0.00mi | 36/36.0 | 21,020 (0%) | 9mo | $5,200,000 | $247 | 93 |
Match score weights: distance 35% · size 25% · config 20% · recency 20%. Top-matched comps best support the ARV.
Projected returns pro-forma
0.0% appreciation · 0.0% rent growth · sell at horizon
- IRR
- 5.4%
- Equity multiple
- 1.25×
- Total profit
- $354,535
- Equity at exit
- $1,452,096
- IRR
- 8.7%
- Equity multiple
- 1.87×
- Total profit
- $1,224,197
- Equity at exit
- $1,745,688
Cash invested: $1,400,000 (down + closing). Projections, not guarantees.
Landlord ↔ Tenant lean methodology
- Overall (STATE)
- 18 Strongly Tenant-Friendly
- State California
- 18 Strongly Tenant-Friendly · D+13
- County
- — inherits STATE
- City
- — inherits STATE
ZIP-level market 91207
- Home prices YoY
- 0.0%
- Rents YoY
- -11.3%
- Active inventory
- 28
- Price-to-rent
- 149.6×
Monthly cashflow live
- Estimated rent
- $50,134 high interval (Pro) →
- Mortgage (P&I)
- −$26,221
- Tax from tax record
- −$1,098 /mo · $13,176/yr
- Insurance
- −$2,083
- HOA
- −$0
- Vacancy / Maint / Mgmt
- −$10,528
- Net cashflow
- $10,204
Break-even live
18-unit breakdown (identical units grouped — click to expand)
| Units | Beds | Baths | Est. rent |
|---|---|---|---|
| 18× units | 2 | 2 | $50,130 |
| #1 | 2 | 2 | $2,785 |
| #2 | 2 | 2 | $2,785 |
| #3 | 2 | 2 | $2,785 |
| #4 | 2 | 2 | $2,785 |
| #5 | 2 | 2 | $2,785 |
| #6 | 2 | 2 | $2,785 |
| #7 | 2 | 2 | $2,785 |
| #8 | 2 | 2 | $2,785 |
| #9 | 2 | 2 | $2,785 |
| #10 | 2 | 2 | $2,785 |
| #11 | 2 | 2 | $2,785 |
| #12 | 2 | 2 | $2,785 |
| #13 | 2 | 2 | $2,785 |
| #14 | 2 | 2 | $2,785 |
| #15 | 2 | 2 | $2,785 |
| #16 | 2 | 2 | $2,785 |
| #17 | 2 | 2 | $2,785 |
| #18 | 2 | 2 | $2,785 |
| Total (18 units) | $50,134 | ||
UW: 25.0% down · 7.5% · 30yr · 1.5% tax · 5.0% vac · 8.0% maint · 8.0% mgmt
Financing live
Cash to close
- Down payment
- $1,250,000
- Closing costs
- $150,000
- Reserves months
- —
- Total cash needed
- —
Loan-product check · same deal, 3 products live
Conventional
25% down · 7.5% · 30yr
- Down + closing
- —
- Monthly P&I
- —
- Monthly cashflow
- —
- DSCR
- —
- Eligible?
- —
Personal DTI + credit; lowest rate.
DSCR
20% down · 8.5% · 30yr
- Down + closing
- —
- Monthly P&I
- —
- Monthly cashflow
- —
- DSCR
- —
- Eligible?
- —
No personal income docs; deal must DSCR.
Hard money
10% down · 12.0% · 12mo
- Down + closing
- —
- Monthly P&I
- —
- Monthly cashflow
- —
- DSCR
- —
- Eligible?
- —
Short-term bridge; refi at stabilization.
Listing history 4 events
-
2026-06-15days on market $5,000,000 Active 4 DOM
-
2026-06-13days on market $5,000,000 Active 2 DOM
-
2026-06-13remarks 699-char remark
-
2026-06-13$5,000,000 Active 1 DOM
ⓘ Source: listings_history table (triggers on properties + properties_extension) + one-shot
backfill from property_details.listing_events for pre-trigger history.
Tax reassessment forecast CA · Resets to sale price
- Current annual tax
- $13,176 · $1,098/mo
- Projected year-2 tax
- $38,000 · $3,167/mo
- Expected delta
- +$24,824/yr (+$2,069/mo · 188.4%)
ⓘ Screening estimate from a state-policy table — verify with the county assessor before closing.
Climate risk First Street
- Flood 1/10 Low FEMA zone X (unshaded) · 0% chance over 30 yrs
- Wildfire 6/10 Major
- Heat 6/10 Major 7 d/yr ≥98°F today · 21 d/yr by 30 yrs out
- Wind 1/10 Low
- Air quality 6/10 Major 11 unhealthy d/yr today · 11 by 30 yrs out
Nearby sold comps map
Loading sold comps map…
Walkable amenities ~0.75 mi
Loading nearby amenities…
Taxation est. · year 1
- Rental income
- $601,608
- − Mortgage interest
- −$280,078
- − Property taxes
- −$13,176
- − Insurance
- −$25,000
- − Repairs & maintenance
- −$48,129
- − Management
- −$48,129
- − Depreciation
- −$145,455
- Taxable income
- $41,643
- Est. tax owed @ 24.0%
- −$9,994
- After-tax cash flow
- $112,454/yr
For passive investors: Depreciation is non-cash, so a rental often shows a tax loss while cash-flowing — sheltering income. Rental losses are passive: they offset passive income freely, and up to $25,000/yr can offset ordinary (W-2) income if you actively participate and your MAGI is under $100k (phasing out to $0 by $150k); unused losses carry forward. On sale, claimed depreciation is recaptured at up to 25%, and gains may owe capital-gains tax (a 1031 exchange can defer both). Figures are a year-1 estimate at your 24.0% rate — not tax advice; consult a CPA.
Schools (NCES district)
- District
- Glendale Unified
- NCES district ID
- 0615240
- Math proficiency
- 53% ▼ -1.00%
- Reading proficiency
- 66% ▲ 2.00%
- Median HH income
- $58,064
- Composite
- 51.38/100
- National rank
- #1733
- State rank
- #81 of 517 in CA
Livability — Glendale
- Score
- 72/100
- State rank
- #201
- US rank
- #6508
Category grades
Schools grade is shown separately in the Schools card above.
Census & demographics
- Census place
- Glendale, CA
- County
- Los Angeles County · 9,444,647 people
- City population
- 172,545
- Metro
- Los Angeles-Long Beach-Anaheim, CA
- Population (ZIP)
- 10,438
- Household income
- $118,116
- Rent vs Own
- Severe rent burden
- 873.0
Population outlook (Los Angeles County) Hauer SSP2
- Today (2025)
- 10,940,515 people
- By 2030
- 11,256,481 · +2.9%
- By 2040
- 11,729,929 · +7.2%
- By 2050
- 11,948,407 · +9.2%
- By 2075
- 11,818,114 · +8.0%
- By 2100
- 10,842,928 · -0.9%
Race, ethnicity, and origin ACS 2023
- Neighborhood character
- Predominantly White (78%)
- Race & ethnicity
- White 78% Asian 9% Two or more races 8% Hispanic / Latino 7% Native American 1%
- Hispanic origin (detail)
- Mexican 3% Cuban 1%
- Common ancestry
- Scotch-Irish 4% Lithuanian 1% Romanian 1%
- Foreign-born
- 43% · Canada, South Korea, China
- Languages at home
- 44% English-only · Other Indo-European 40% Spanish 5% Korean 3%
Political lean MEDSL · Los Angeles
- 2024 margin
- Solid D (+32.9) · D 64.8% · R 31.9% · Other 3.3%
- 2008→2024 swing
- -7.4pp toward R · 2008: 40.4pp · 2024: 32.9pp
- All cycles
- 2024: D+32.9 2020: D+44.2 2016: D+48.0 2012: D+40.0 2008: D+40.4
Not yet ingested
- Civics
- —
Market trends
- HPI YoY
- ▬ 0.00%
- Current HPI
- 421.4944
- Rent YoY
- ▼ -11.28%
- Metro
- Los Angeles-Long Beach-Anaheim, CA
- State GDP YoY
- ▲ 3.21%
- F500 in state
- 116
Industry mix (Fortune 500 HQ in CA)
| Industry | F500 HQs | Revenue |
|---|---|---|
| Technology | 27 | $1,492B |
|
||
| Financial Services | 3 | $174B |
|
||
| Retail | 3 | $44B |
|
||
| Insurance | 3 | $26B |
|
||
| Media / Entertainment | 2 | $115B |
|
||
| Pharmaceuticals / Biotech | 2 | $62B |
|
||
Price history
+1076.5% since first listed6 events — show timeline
- 2026-06-11 Listed $5,000,000 TheMLS
- 2025-10-03 Sold (Public Records) $5,200,000 Public Records
- 2025-10-03 Sold (MLS) $5,200,000 TheMLS
- 2025-08-07 Contingent — TheMLS
- 2025-07-25 Listed $6,350,000 TheMLS
- 1976-09-20 Sold (Public Records) $425,000 Public Records
Property tax history
+1.9%/yrLatest (2025): $13,176 · +1.3% YoY. Source: county tax records.
Cash-flow waterfall
monthlySold comps — $/sqft
last 12 mo · ≤1 miLoading sold comps…