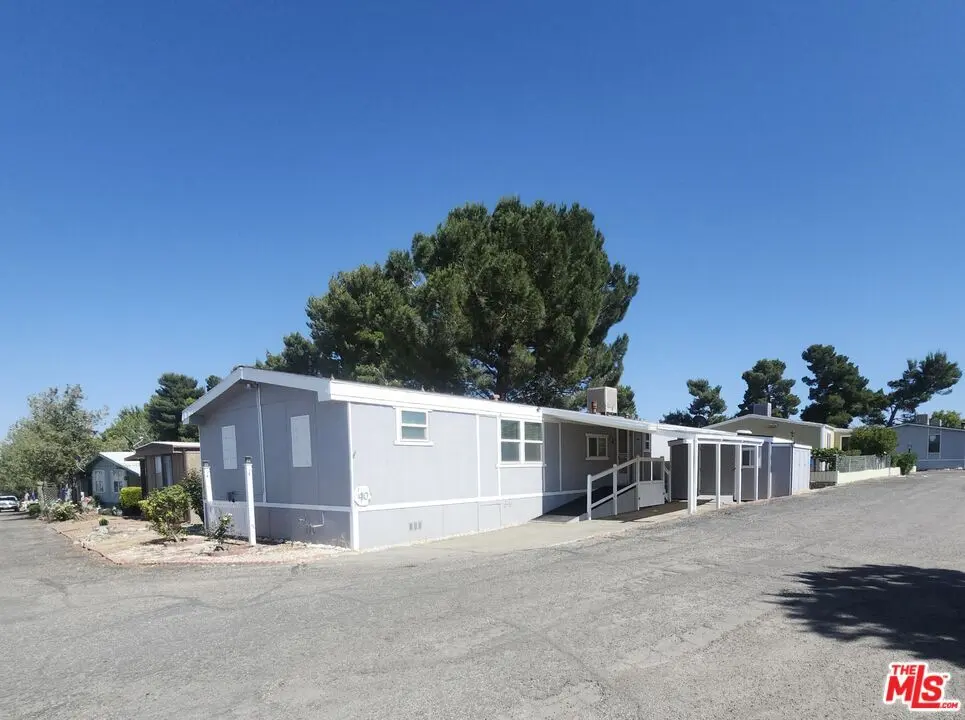
10200 Johnson Rd #40
Phelan, CA 92371
$119,000B+
3 bd · 2.0 ba ·
1,500 sqft ·
Built 1979
· Manufactured
· Active
· 15 DOM
Cashflow @ list (25.0% down · 7.5%)
Estimated rent
$2,700/mo
Mortgage (P&I)
−$624
Tax + insurance
−$198
HOA
−$950
Vac / Maint / Mgmt
−$567
Net cashflow
$361/mo
Annual
$4,327/yr
Cap rate
9.93%
Cash-on-cash
12.99%
DSCR
1.58
1% rule
2.27%
Cash to close
$33,320
Investor read
- This is a 3-bed/2.0-bath manufactured listed at $119k. Condition is rated good.
- At list price, monthly cash flow is $361 ($4k/yr) — positive.
- The deal already cash-flows at list — no discount required.
- Meets the 1% rule at list price ($3k rent vs $119k).
- It's been on market 15 days — a 2% lower offer ($117k) is reasonable based on typical stale-listing flexibility.
- Recommended offer: $117k (1.5% below list) — sets the bar for market timing.
- In year one you build about $9k of equity ($823 loan paydown + $8k appreciation (6.6% local appreciation)).
- Location reads 48/100 on livability (#1,215 in CA) — a working-class tenant base; expect higher turnover. Strengths: housing A+; Watch: employment C-, schools D+, crime F.
- Snowline Joint Unified (rural): math 34% / reading 44% proficiency, ranked #722 of 1,400 in CA (top 52%) — families likely to look elsewhere, expect single-tenant / working-renter base with shorter leases.
- Watch-outs: HOA is 35% of rent.
- Market conditions: 292 active listings in the ZIP; 1 comparable units currently listed for rent nearby; 5,458 units permitted in San Bernardino County in 2024 (1,500 in 5+ unit buildings).
- San Bernardino County population projected at +15% by 2050 — modest demand growth; plan on rents tracking national, not racing it.
- At projected returns (6.6% appreciation + 3.0% rent growth), your $33k cash investment doubles in ~3 years — after that, you're playing with house money.
- By year 5, paydown + projected appreciation supports a ~$39k cash-out refi (75% LTV) — recoverable capital for the next deal without selling this one.
- Climate carrying-cost: major wildfire risk; extreme-heat days projected 5→12/yr by 2055 (HVAC capex compounding) — expect insurance premiums to compound above CPI over the hold.
- Cap rate 9.9% vs local median 3.6% in Phelan — top-decile yield for the area; either an underpriced asset or a hidden risk that comps aren't pricing in. Stress-test before assuming the spread holds.
Questions for listing agent
- Built in 1979 — when were the roof, HVAC, electrical panel, plumbing, and water heater last replaced?
- What does the HOA fee cover, when was the last increase, and are there any pending special assessments or reserve-fund shortfalls?
- Is there a deadline driving the sale (1031 exchange, divorce, estate, relocation)? That informs how much negotiation room exists.
- Schools are D-rated, which usually means shorter tenancies and higher turnover. Who's the typical renter profile here, and what's been the actual vacancy rate?
- Crime grade is F in this area — have there been break-ins, vandalism, or insurance claims at this property in the last 3 years? What carrier currently insures it and at what premium?
- What's the average days-on-market for RENTAL listings here right now (not sales)? A rising rental-DOM trend means longer vacancies and softer asking-rent achievability than the comps imply.
- What's the recent tenant-quality profile in this submarket — average credit score on applications, eviction rate, late-payment / NSF rate, and stable-employment percentage? A property-management company in the area should have these aggregated.
- How much new for-sale + rental construction is in the pipeline within 1–3 miles? Heavy new supply typically softens prices + rents 12–24 months out; constrained supply supports both.
CashFlowRE · CFR-DKKF1JEESX2ZYA
· Data 2 days ago
cashflowre.app · 2026-05-29