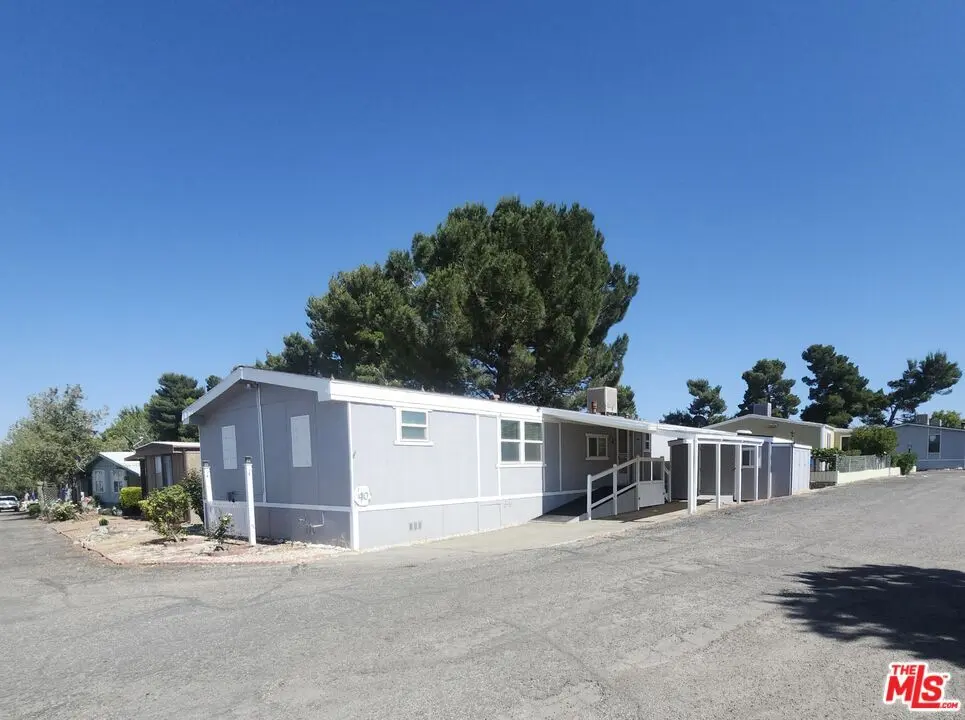
10200 Johnson Rd #40 · Phelan, CA
Flood risk 1/10 · Minimal
- FEMA flood zone
- X (shaded)
- Chance of flooding over 30 yrs
- 0.0%
- Est. flood insurance / yr
- $507 – $1,088
Fire risk 7/10 · Major
- Est. fire insurance / yr
- $659 – $1,223
Heat risk 5/10 · Moderate
- Hot days now (above 94°F)
- 5 days/yr
- Hot days in 30 yrs
- 12 days/yr
Wind risk 1/10 · Minimal
- Chance of severe wind over 30 yrs
- —
Air-quality risk 10/10 · Severe
- Unhealthy air days now
- 26 days/yr
- Unhealthy air days in 30 yrs
- 30 days/yr
Risk factors via First Street. Map © Google.
Why this score? — see what drove the B+ grade
The composite is a weighted blend of 9 inputs, each scored 0–100. Each bar is that input's sub-score; the figure is the points it added to the 100-point composite (weight × sub-score).
- Cash flow +27.7/30.0
- 1% rule +10.0/10.0
- DSCR +9.8/10.0
- Appreciation +8.3/10.0
- ARV discount +7.5/15.0
- Condition / age +3.8/5.0
- Schools +3.7/10.0
- Rent growth +2.5/5.0
- Livability +2.4/5.0
$119,000
🖨 Deal sheet 📄 Offer letter ✓ Due diligence
Listing remarks
55+ Community with a pool. Private, rear corner lot. Easy visitor parking. Completely updated and upgraded in 2016. Built-ins, kitchen, bathrooms all living spaces are BEAUTIFUL! MUST SEE. Enclosed patio 17x7 feet. Two large sheds 12x8 and 12x10. Tastefully modern and cozy. Immaculate condition. Can be purchased fully furnished or empty. Truly one of the nicest mobiles this agent has ever seen. Come have a look!
Key facts
- 2 parking spots
- Community pool
- Built 1979
Property features AI
Finance
- Other: Directions: Phelan Rd to Johnson Rd, north to address (Johnson and Smoke Tree cross streets)
- Financial info: Property sold as-is
- HOA & community: Senior park (Sierra Vista Mobile Estates); HOA amenities include clubhouse and pool; Association allows pets; Approximately 60 units in the community; Monthly/annual fee applies
Exterior
- Parking: Attached carport; 2 covered parking spaces
- Utilities: Land not included (space rent in mobile home park)
- Home design: Residential mobile home (double wide); Single-story; Faces west; Aluminum skirt
- Construction: Manufactured by MATEC; Manufacture date: 1978; Dimensions: 60 x 25; Serial numbers on file
- Exterior features: Corner lot; Association indoor pool; Association in-ground pool; Community clubhouse; Has view: Desert
Interior
- Kitchen: Gas/Electric range; Microwave; Hood fan; Garbage disposal; Refrigerator; Freezer; Range/oven; Water filter; Water line to refrigerator; Dishwasher
- Flooring: Laminate floors; Carpeted floors
- Bathrooms: 2 full bathrooms
- Heating & cooling: Natural gas heating; Swamp cooler(s)
- Interior features: Furnished or available unfurnished; Built-in cabinetry; Ceiling fan; Walk-in closet; Workshop; Covered patio; Dining area; Has desert view
- Laundry & utility: Laundry area; Laundry in closet; Gas or electric dryer hookup; Dryer
Neighborhood map
What this means for you Summary
Snapshot
- This is a 3-bed/2.0-bath manufactured listed at $119k. Condition is rated good.
Deal economics
- At list price, monthly cash flow is $361 ($4k/yr) — positive.
- The deal already cash-flows at list — no discount required.
- Meets the 1% rule at list price ($3k rent vs $119k).
- Recommended offer: $117k (1.5% below list) — sets the bar for market timing.
- Cap rate 9.9% vs local median 3.6% in Phelan — top-decile yield for the area; either an underpriced asset or a hidden risk that comps aren't pricing in. Stress-test before assuming the spread holds.
Location & tenants
- Location reads 48/100 on livability (#1,215 in CA) — a working-class tenant base; expect higher turnover. Strengths: housing A+; Watch: employment C-, schools D+, crime F.
- Snowline Joint Unified (rural): math 34% / reading 44% proficiency, ranked #722 of 1,400 in CA (top 52%) — families likely to look elsewhere, expect single-tenant / working-renter base with shorter leases.
- Market conditions: 292 active listings in the ZIP; 1 comparable units currently listed for rent nearby; 5,458 units permitted in San Bernardino County in 2024 (1,500 in 5+ unit buildings).
Forward outlook
- In year one you build about $9k of equity ($823 loan paydown + $8k appreciation (6.6% local appreciation)).
- San Bernardino County population projected at +15% by 2050 — modest demand growth; plan on rents tracking national, not racing it.
- At projected returns (6.6% appreciation + 3.0% rent growth), your $33k cash investment doubles in ~3 years — after that, you're playing with house money.
- By year 5, paydown + projected appreciation supports a ~$39k cash-out refi (75% LTV) — recoverable capital for the next deal without selling this one.
Negotiation context
- It's been on market 15 days — a 2% lower offer ($117k) is reasonable based on typical stale-listing flexibility.
Risks & watch-outs
- Watch-outs: HOA is 35% of rent.
- Climate carrying-cost: major wildfire risk; extreme-heat days projected 5→12/yr by 2055 (HVAC capex compounding) — expect insurance premiums to compound above CPI over the hold.
Questions for the listing agent
- Built in 1979 — when were the roof, HVAC, electrical panel, plumbing, and water heater last replaced?
- What does the HOA fee cover, when was the last increase, and are there any pending special assessments or reserve-fund shortfalls?
- Is there a deadline driving the sale (1031 exchange, divorce, estate, relocation)? That informs how much negotiation room exists.
- Schools are D-rated, which usually means shorter tenancies and higher turnover. Who's the typical renter profile here, and what's been the actual vacancy rate?
- Crime grade is F in this area — have there been break-ins, vandalism, or insurance claims at this property in the last 3 years? What carrier currently insures it and at what premium?
- What's the average days-on-market for RENTAL listings here right now (not sales)? A rising rental-DOM trend means longer vacancies and softer asking-rent achievability than the comps imply.
- What's the recent tenant-quality profile in this submarket — average credit score on applications, eviction rate, late-payment / NSF rate, and stable-employment percentage? A property-management company in the area should have these aggregated.
- How much new for-sale + rental construction is in the pipeline within 1–3 miles? Heavy new supply typically softens prices + rents 12–24 months out; constrained supply supports both.
Investment metrics
- 1% rule
- 2.27% ✓
- Cap rate
- 9.93%
- Cash-on-cash
- 12.99%
- DSCR
- 1.58
- GRM
- 3.7
CMA / ARV
- ARV (on-the-fly)
- $342,000
- Comps found
- 3
Show comp detail 3 sales within ~0.75 mi
| Address | Dist | Beds/Ba | Sqft | Sold | Price | $/sf | Match |
|---|---|---|---|---|---|---|---|
| 10200 Johnson Rd #28 | 0.00mi | 3/2.0 | 1,568 (+4%) | 13mo | $90,000 | $57 | 82 |
| 4575 Smoke Tree Rd | 0.42mi | 3/2.0 | 1,512 (+1%) | 22mo | $345,000 | $228 | 61 |
| 4848 Walnut Rd | 0.52mi | 3/2.0 | 1,296 (-14%) | 14mo | $350,000 | $270 | 42 |
Match score weights: distance 35% · size 25% · config 20% · recency 20%. Top-matched comps best support the ARV.
Projected returns pro-forma
6.62% appreciation · 3.0% rent growth · sell at horizon
- IRR
- 27.6%
- Equity multiple
- 2.87×
- Total profit
- $62,349
- Equity at exit
- $79,488
- IRR
- 25.6%
- Equity multiple
- 5.97×
- Total profit
- $165,661
- Equity at exit
- $148,370
Cash invested: $33,320 (down + closing). Projections, not guarantees.
Landlord ↔ Tenant lean methodology
- Overall (STATE)
- 18 Strongly Tenant-Friendly
- State California
- 18 Strongly Tenant-Friendly · D+13
- County
- — inherits STATE
- City
- — inherits STATE
ZIP-level market 92371
- Home prices YoY
- 1.6%
- Active inventory
- 292
- Price-to-rent
- 3.7×
Monthly cashflow live
- Estimated rent
- $2,700 medium interval (Pro) →
- Mortgage (P&I)
- −$624
- Tax est. 1.5%
- −$149 /mo · $1,785/yr
- Insurance
- −$50
- HOA
- −$950
- Vacancy / Maint / Mgmt
- −$567
- Net cashflow
- $361
Break-even live
UW: 25.0% down · 7.5% · 30yr · 1.5% tax · 5.0% vac · 8.0% maint · 8.0% mgmt
Financing live
Cash to close
- Down payment
- $29,750
- Closing costs
- $3,570
- Reserves months
- —
- Total cash needed
- —
Loan-product check · same deal, 3 products live
Conventional
25% down · 7.5% · 30yr
- Down + closing
- —
- Monthly P&I
- —
- Monthly cashflow
- —
- DSCR
- —
- Eligible?
- —
Personal DTI + credit; lowest rate.
DSCR
20% down · 8.5% · 30yr
- Down + closing
- —
- Monthly P&I
- —
- Monthly cashflow
- —
- DSCR
- —
- Eligible?
- —
No personal income docs; deal must DSCR.
Hard money
10% down · 12.0% · 12mo
- Down + closing
- —
- Monthly P&I
- —
- Monthly cashflow
- —
- DSCR
- —
- Eligible?
- —
Short-term bridge; refi at stabilization.
Rent comps 1 comps
| Address | Beds | Baths | Sqft | Rent | $/sqft | DOM | Units | Dist |
|---|---|---|---|---|---|---|---|---|
| 11010 Valle Vista Rd Phelan, CA | 3.0 | 2.0 | 1488 | $2,700 | $1.81 | 1d | 1 | 1.20mi |
HOA detail
- Monthly dues
- $950 · $11,400/yr
- Likely covers
- pool
Listing history 15 events
-
2026-06-18days on market $119,000 Active 15 DOM
-
2026-06-17days on market $119,000 Active 14 DOM
-
2026-06-16days on market $119,000 Active 13 DOM
-
2026-06-15days on market $119,000 Active 12 DOM
-
2026-06-13days on market $119,000 Active 10 DOM
-
2026-06-09days on market $119,000 Active 6 DOM
-
2026-06-08days on market $119,000 Active 5 DOM
-
2026-06-07remarks 415-char remark
-
2026-06-07days on market $119,000 Active 4 DOM
-
2026-06-04statusdays on market $119,000 Active 1 DOM
-
2026-06-03days on market $119,000 Coming Soon 8 DOM
-
2026-06-02days on market $119,000 Coming Soon 7 DOM
-
2026-06-01days on market $119,000 Coming Soon 6 DOM
-
2026-05-31days on market $119,000 Coming Soon 5 DOM
-
2026-05-26historical $119,000
ⓘ Source: listings_history table (triggers on properties + properties_extension) + one-shot
backfill from property_details.listing_events for pre-trigger history.
Climate risk First Street
- Flood 1/10 Low FEMA zone X (shaded) · 0% chance over 30 yrs
- Wildfire 7/10 Severe
- Heat 5/10 Major 5 d/yr ≥94°F today · 12 d/yr by 30 yrs out
- Wind 1/10 Low
- Air quality 10/10 Extreme 26 unhealthy d/yr today · 30 by 30 yrs out
Nearby sold comps map
Loading sold comps map…
Walkable amenities ~0.75 mi
Loading nearby amenities…
Taxation est. · year 1
- Rental income
- $32,400
- − Mortgage interest
- −$6,666
- − Property taxes
- −$1,785
- − Insurance
- −$595
- − Repairs & maintenance
- −$2,592
- − Management
- −$2,592
- − HOA
- −$11,400
- − Depreciation
- −$3,462
- Taxable income
- $3,308
- Est. tax owed @ 24.0%
- −$794
- After-tax cash flow
- $3,533/yr
For passive investors: Depreciation is non-cash, so a rental often shows a tax loss while cash-flowing — sheltering income. Rental losses are passive: they offset passive income freely, and up to $25,000/yr can offset ordinary (W-2) income if you actively participate and your MAGI is under $100k (phasing out to $0 by $150k); unused losses carry forward. On sale, claimed depreciation is recaptured at up to 25%, and gains may owe capital-gains tax (a 1031 exchange can defer both). Figures are a year-1 estimate at your 24.0% rate — not tax advice; consult a CPA.
Condition & rehab AI · 2 photos
This manufactured home is in good condition with no major repairs needed. It has been updated and upgraded in 2016, making it a solid investment with potential for further value increases through cosmetic improvements.
Value-add opportunities
- Both Paint exterior — Painting the exterior can enhance curb appeal and increase both resale and rental value.
- Both Landscaping improvements — Improving the landscaping can enhance curb appeal and increase both resale and rental value.
Renovation cost estimate screening
Value-add ROI direction
- Both Paint exterior — Painting the exterior can enhance curb appeal and increase both resale and rental value. ↑
- Both Landscaping improvements — Improving the landscaping can enhance curb appeal and increase both resale and rental value. ↑
ⓘ Cost ranges are severity-bucket heuristics (US national rule-of-thumb). Get contractor quotes + a written scope before underwriting a rehab budget.
Schools (NCES district)
- District
- Snowline Joint Unified
- NCES district ID
- 0636970
- Math proficiency
- 34% ▲ 1.00%
- Reading proficiency
- 44% ▬ 0.00%
- Median HH income
- $57,625
- Composite
- 36.84/100
- National rank
- #9157
- State rank
- #722 of 1400 in CA
Livability — Phelan
- Score
- 48/100
- State rank
- #1215
- US rank
- #26148
Category grades
Schools grade is shown separately in the Schools card above.
Census & demographics
- Census place
- Phelan, CA
- City population
- 21,678
- Population (ZIP)
- 21,678
Population outlook (San Bernardino County) Hauer SSP2
- Today (2025)
- 2,300,329 people
- By 2030
- 2,378,907 · +3.4%
- By 2040
- 2,523,137 · +9.7%
- By 2050
- 2,642,388 · +14.9%
- By 2075
- 2,880,769 · +25.2%
- By 2100
- 2,909,436 · +26.5%
Race, ethnicity, and origin ACS 2023
- Neighborhood character
- Diverse neighborhood (Simpson 0.57)
- Race & ethnicity
- Hispanic / Latino 47% White 45% Two or more races 22% Asian 3% Native American 1%
- Hispanic origin (detail)
- Mexican 41% Puerto Rican 1%
- Common ancestry
- Iranian 2% Italian 2% Slovak 2%
- Foreign-born
- 13% · Canada, South Korea
- Languages at home
- 71% English-only · Spanish 26% Korean 2%
Political lean MEDSL · San Bernardino
- 2024 margin
- Toss-up / Even · D 47.5% · R 49.7% · Other 2.8%
- 2008→2024 swing
- -8.5pp toward R · 2008: 6.3pp · 2024: -2.1pp
- All cycles
- 2024: R+2.1 2020: D+10.7 2016: D+9.8 2012: D+5.4 2008: D+6.3
Not yet ingested
- Civics
- —
Market trends
- HPI YoY
- ▲ 6.62%
- Current HPI
- 425.631
- Rent YoY
- —
- Metro
- —
- State GDP YoY
- ▲ 3.21%
- F500 in state
- 116
Industry mix (Fortune 500 HQ in CA)
| Industry | F500 HQs | Revenue |
|---|---|---|
| Technology | 27 | $1,492B |
|
||
| Financial Services | 3 | $174B |
|
||
| Retail | 3 | $44B |
|
||
| Insurance | 3 | $26B |
|
||
| Media / Entertainment | 2 | $115B |
|
||
| Pharmaceuticals / Biotech | 2 | $62B |
|
||
Price history
1 event — show timeline
- 2026-05-26 Coming Soon $119,000 TheMLS
Cash-flow waterfall
monthlySold comps — $/sqft
last 12 mo · ≤1 miLoading sold comps…